Mapping the Distribution and Spread of Social Ties Over Time: A Case Study Using Facebook Friends

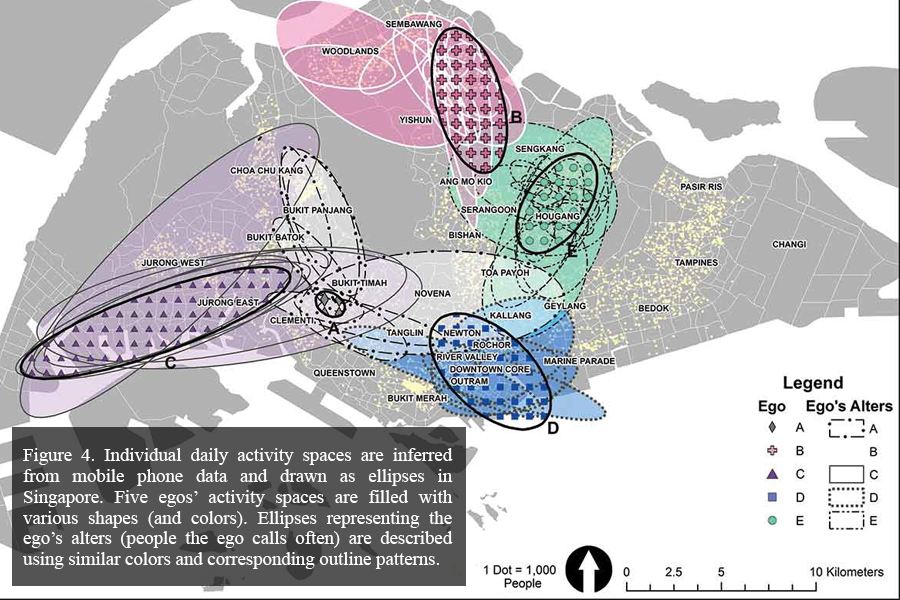
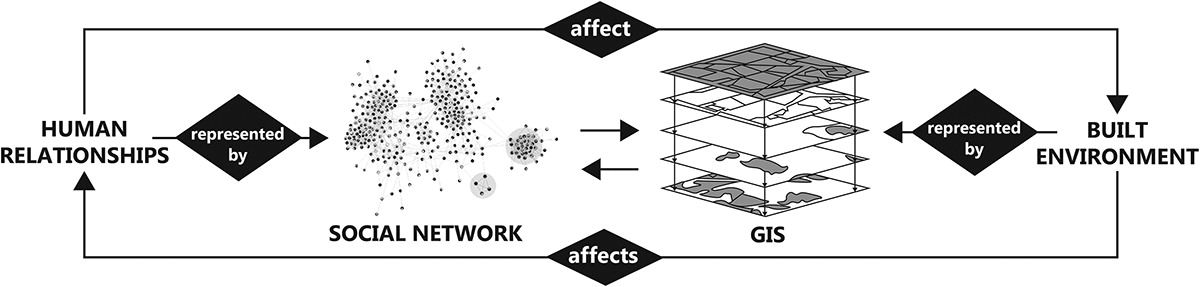
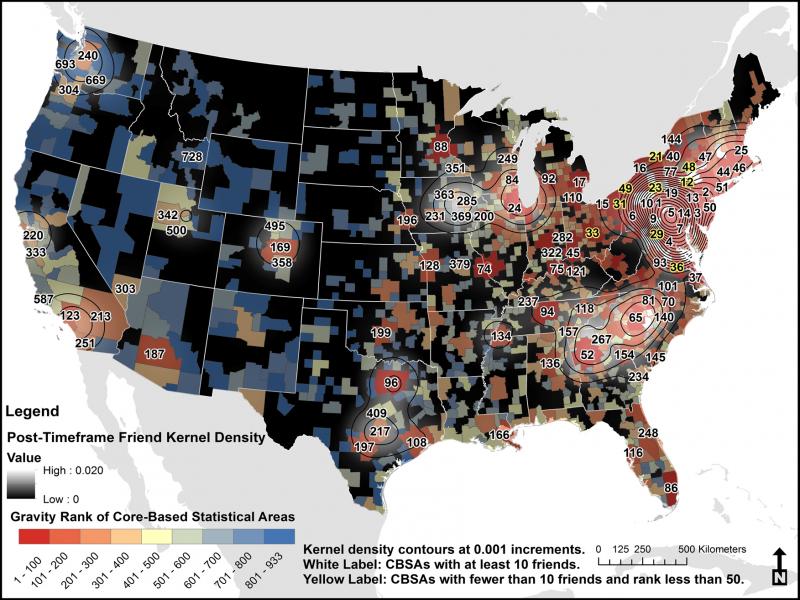
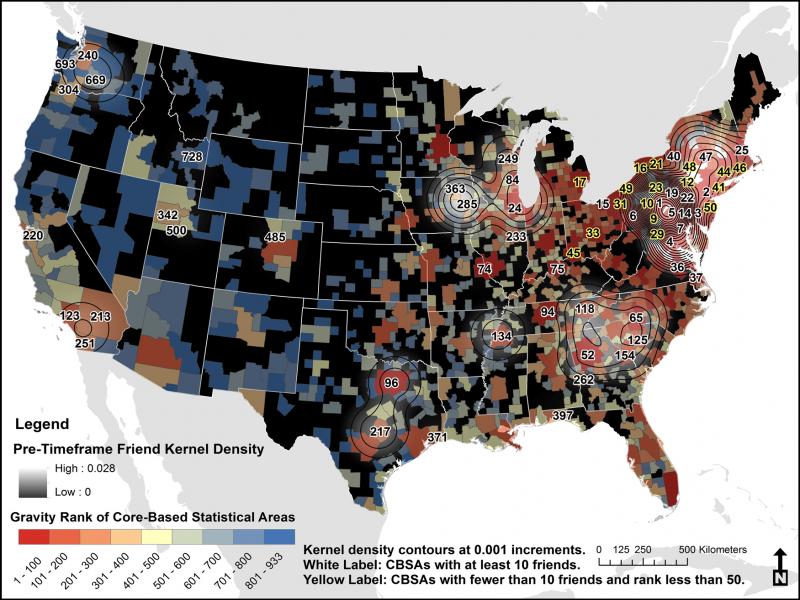
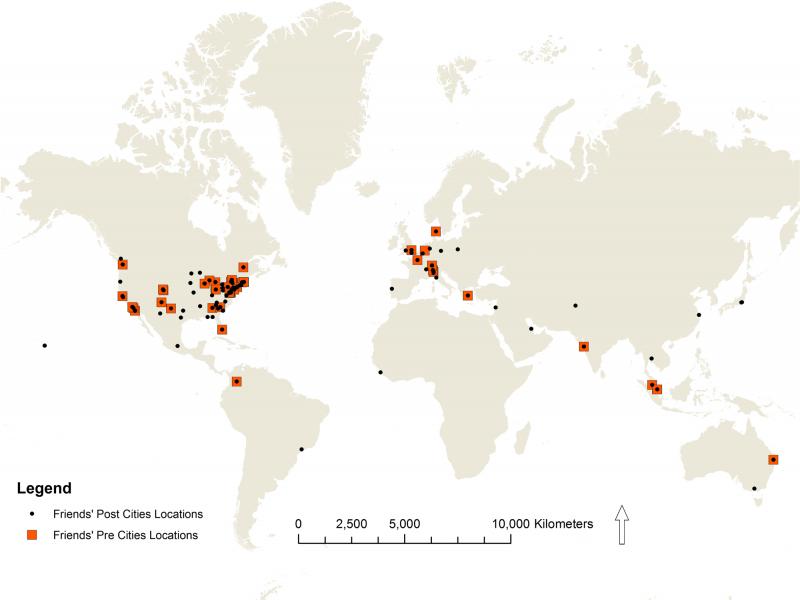
Relational geography asserts that social networks provide geographic benefits, and geographies are transmitted through the sharing of local knowledge and experience. In this work, the authors conduct a case study to map social network ties in geographic space. The authors retrieve social network matrices for 20 volunteers (egos) via Facebook.com, amounting to over 8,500 friends (alters). Each ego listed the alter’s hometown city at two time periods: at relationship inception and at the time of the study. The authors measure specific tie locations, tie expanse, deviation from a gravity model prediction, and expansion of the alter groups (family, clubs, neighbors, etc.) over time.

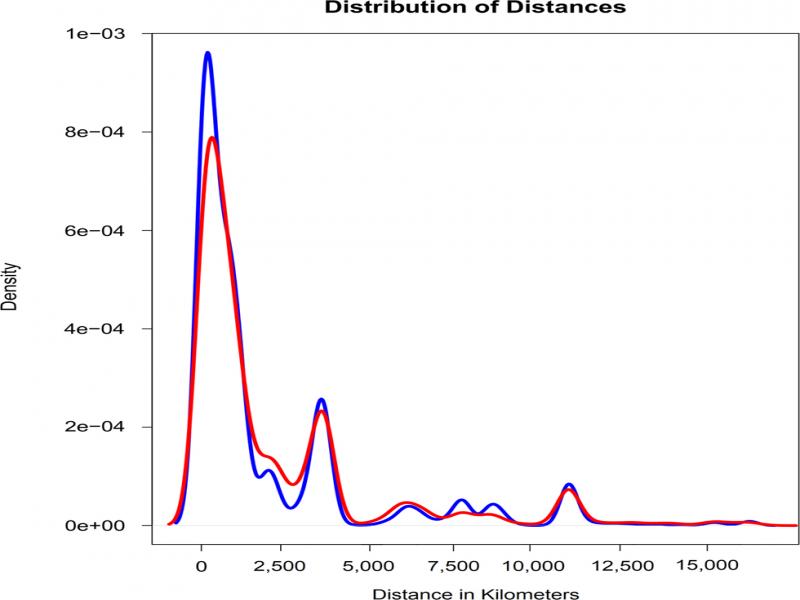
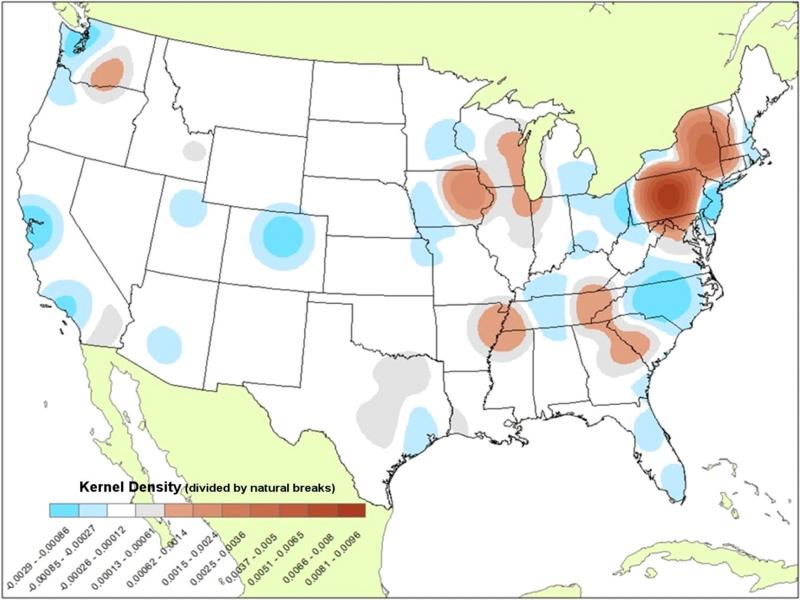
The authors find that social networks geographically spread over time, on average, from 2,679 km (standard distance) to 3,258 km (standard distance), and that the average ego had alters in 21 unique locations when they met, and 38 locations at the time of the study. Regarding friend groups, the authors discover that high school friends and friends from non-residential gatherings (ex. conferences) dispersed the most (over 1,900 km), and cultural groups (churches, sports teams) and family dispersed the least (less than 800 km) over time. Our results lead to a discussion of how mapping and measuring the distribution of social connections can uncover changing dynamics of social interaction, and one’s ability to access and engage with places through social ties.

Andris C, Cavallo S, Dzwonczyk E, Clemente-Harding L, Hultquist C and Ozanne M (2019) Mapping the Distribution and Spread of Social Ties Over Time: A Case Study Using Facebook Friends. Connections: Journal of the International Network for Social Network Analysis. 1(39): 1-17.

Threads Across the Urban Fabric: Personal Relationships in the City

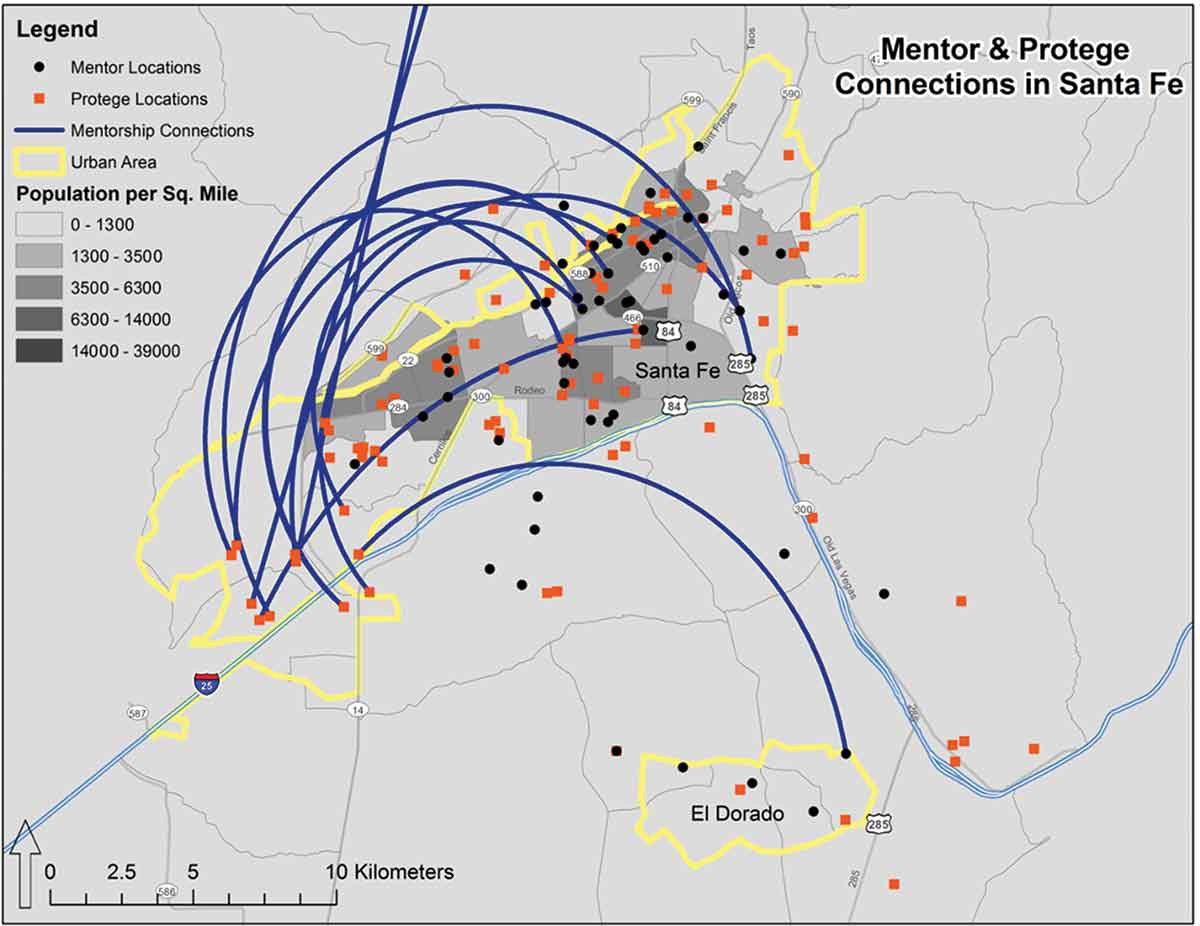
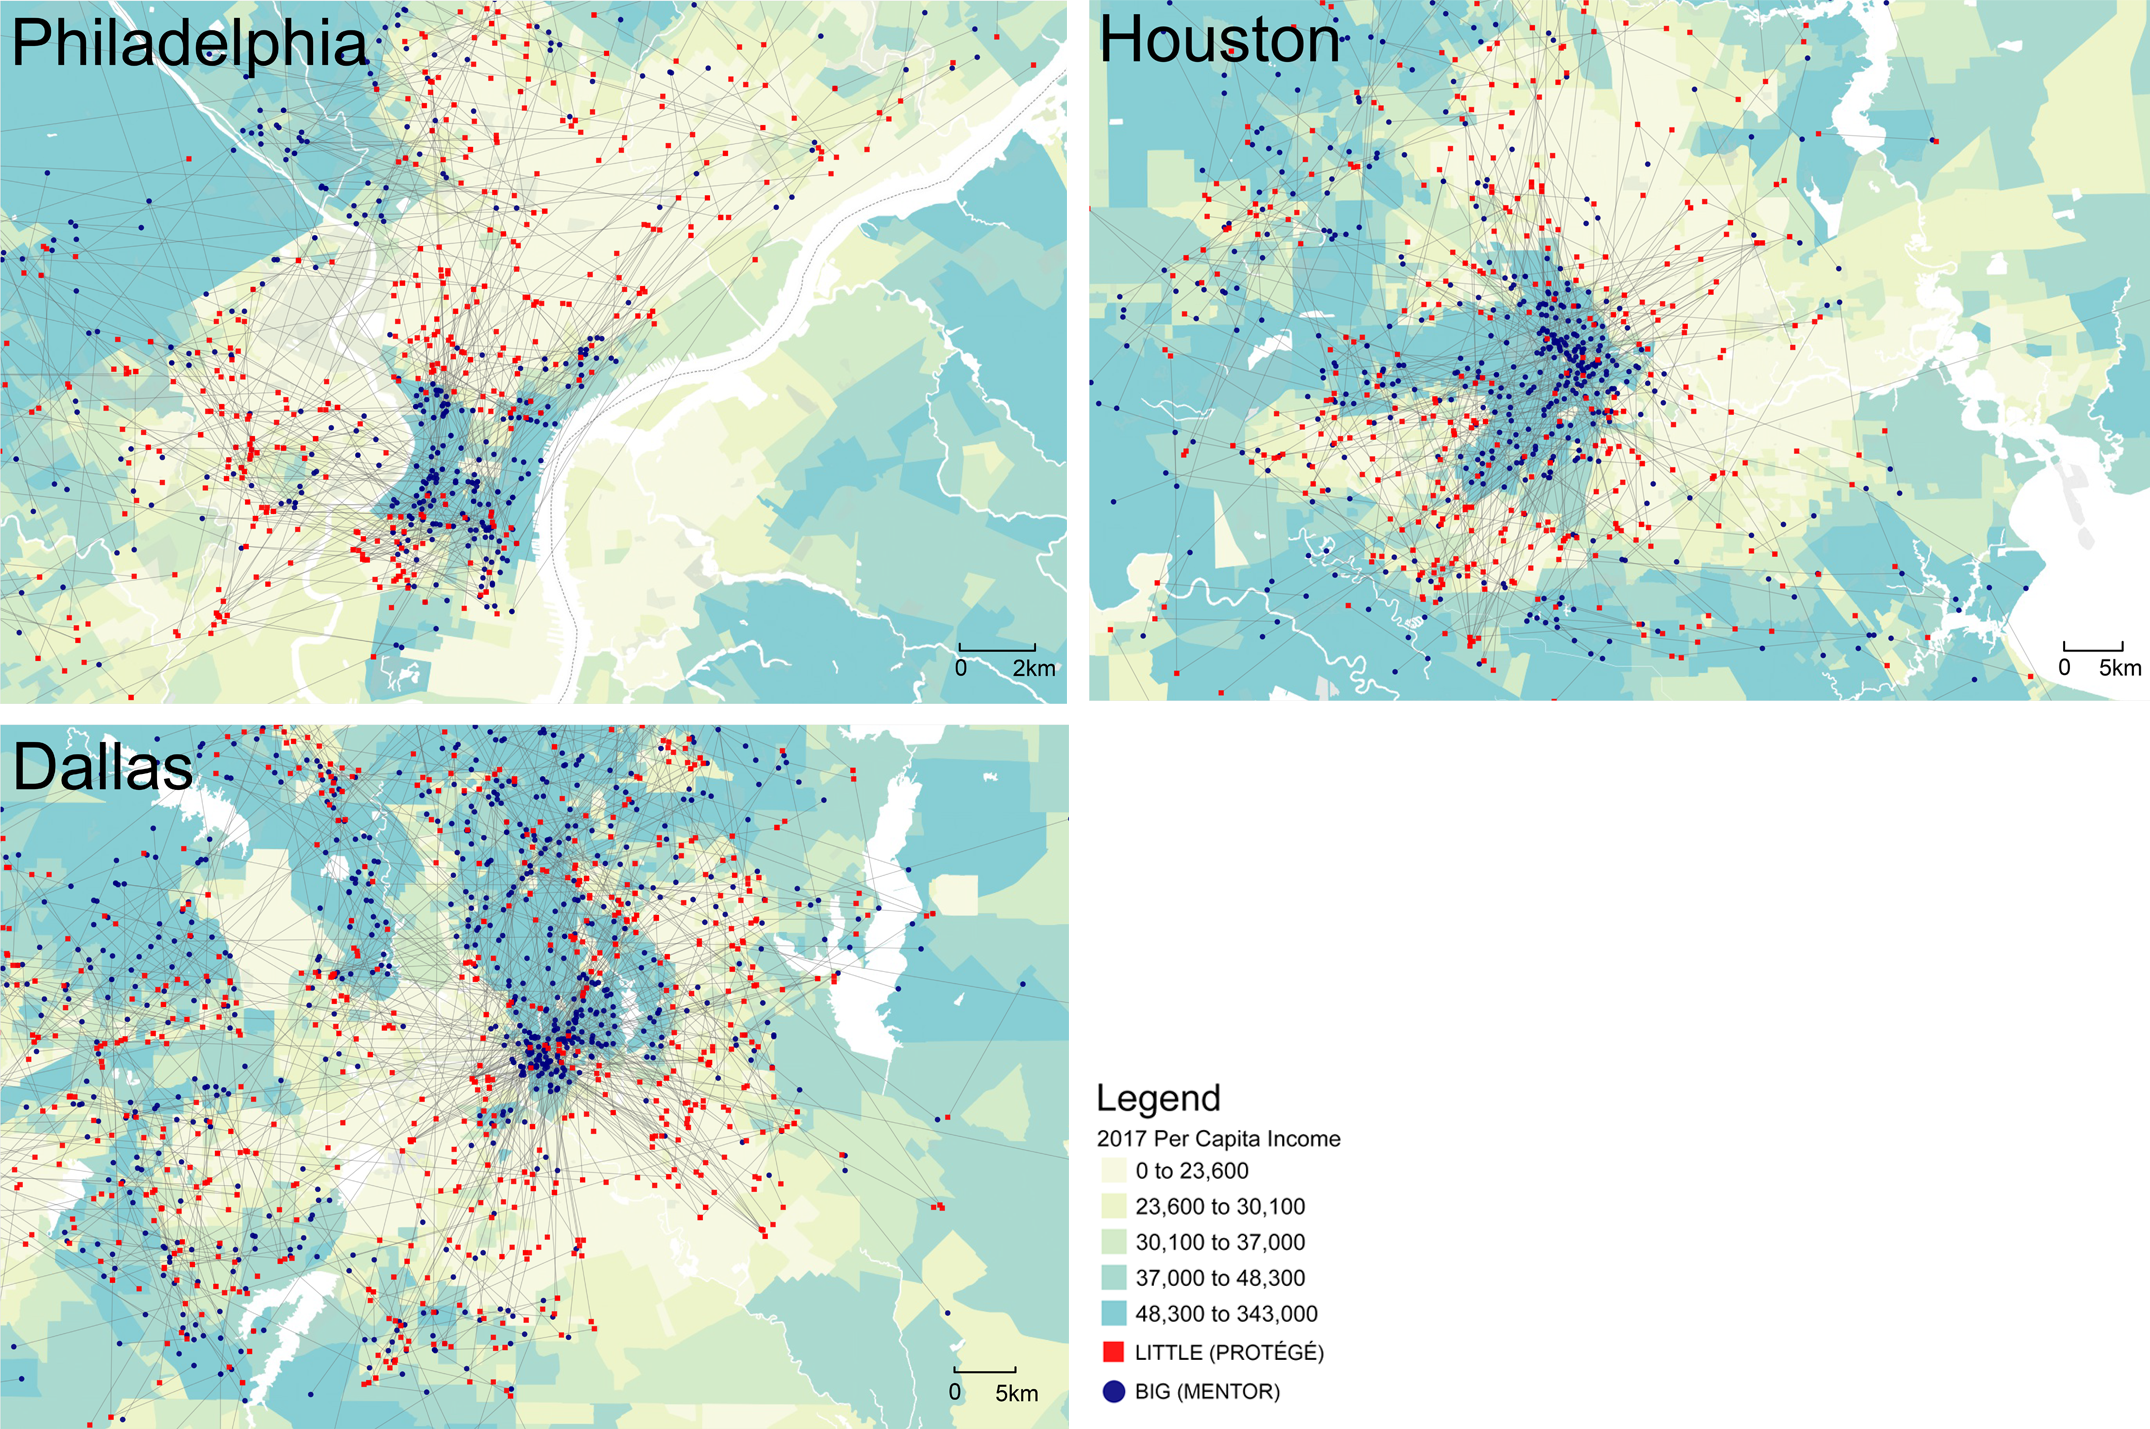
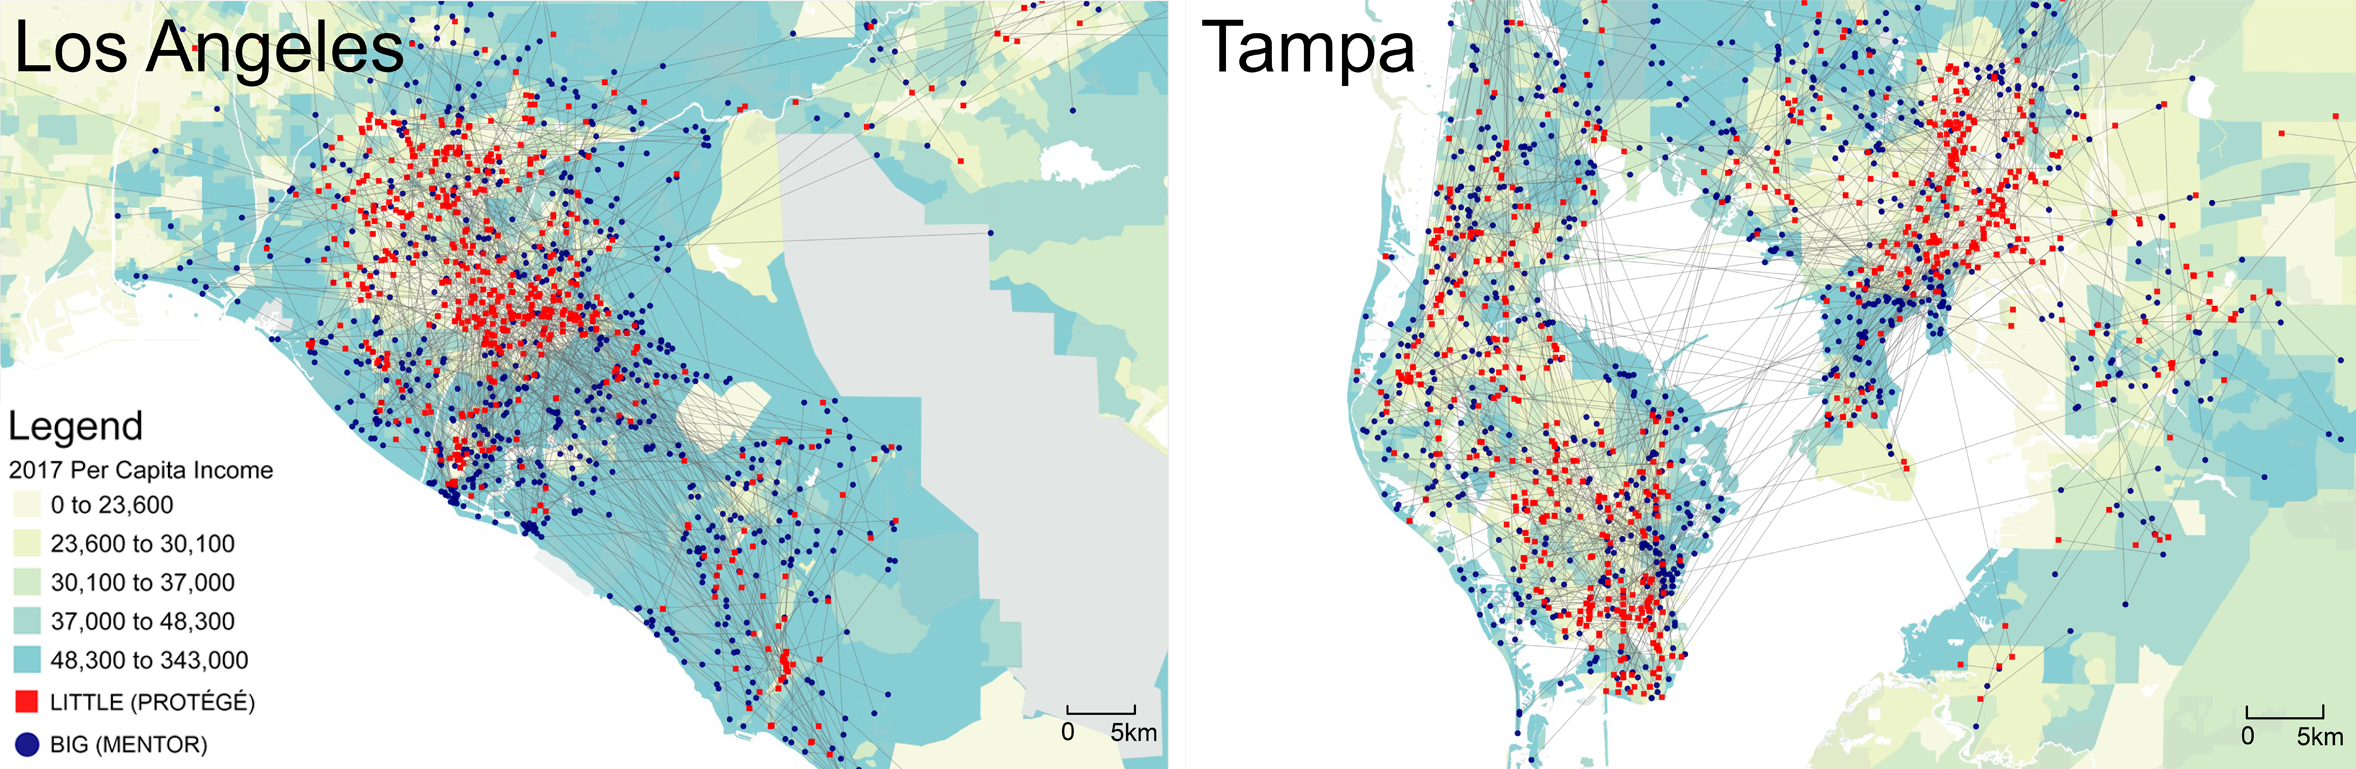
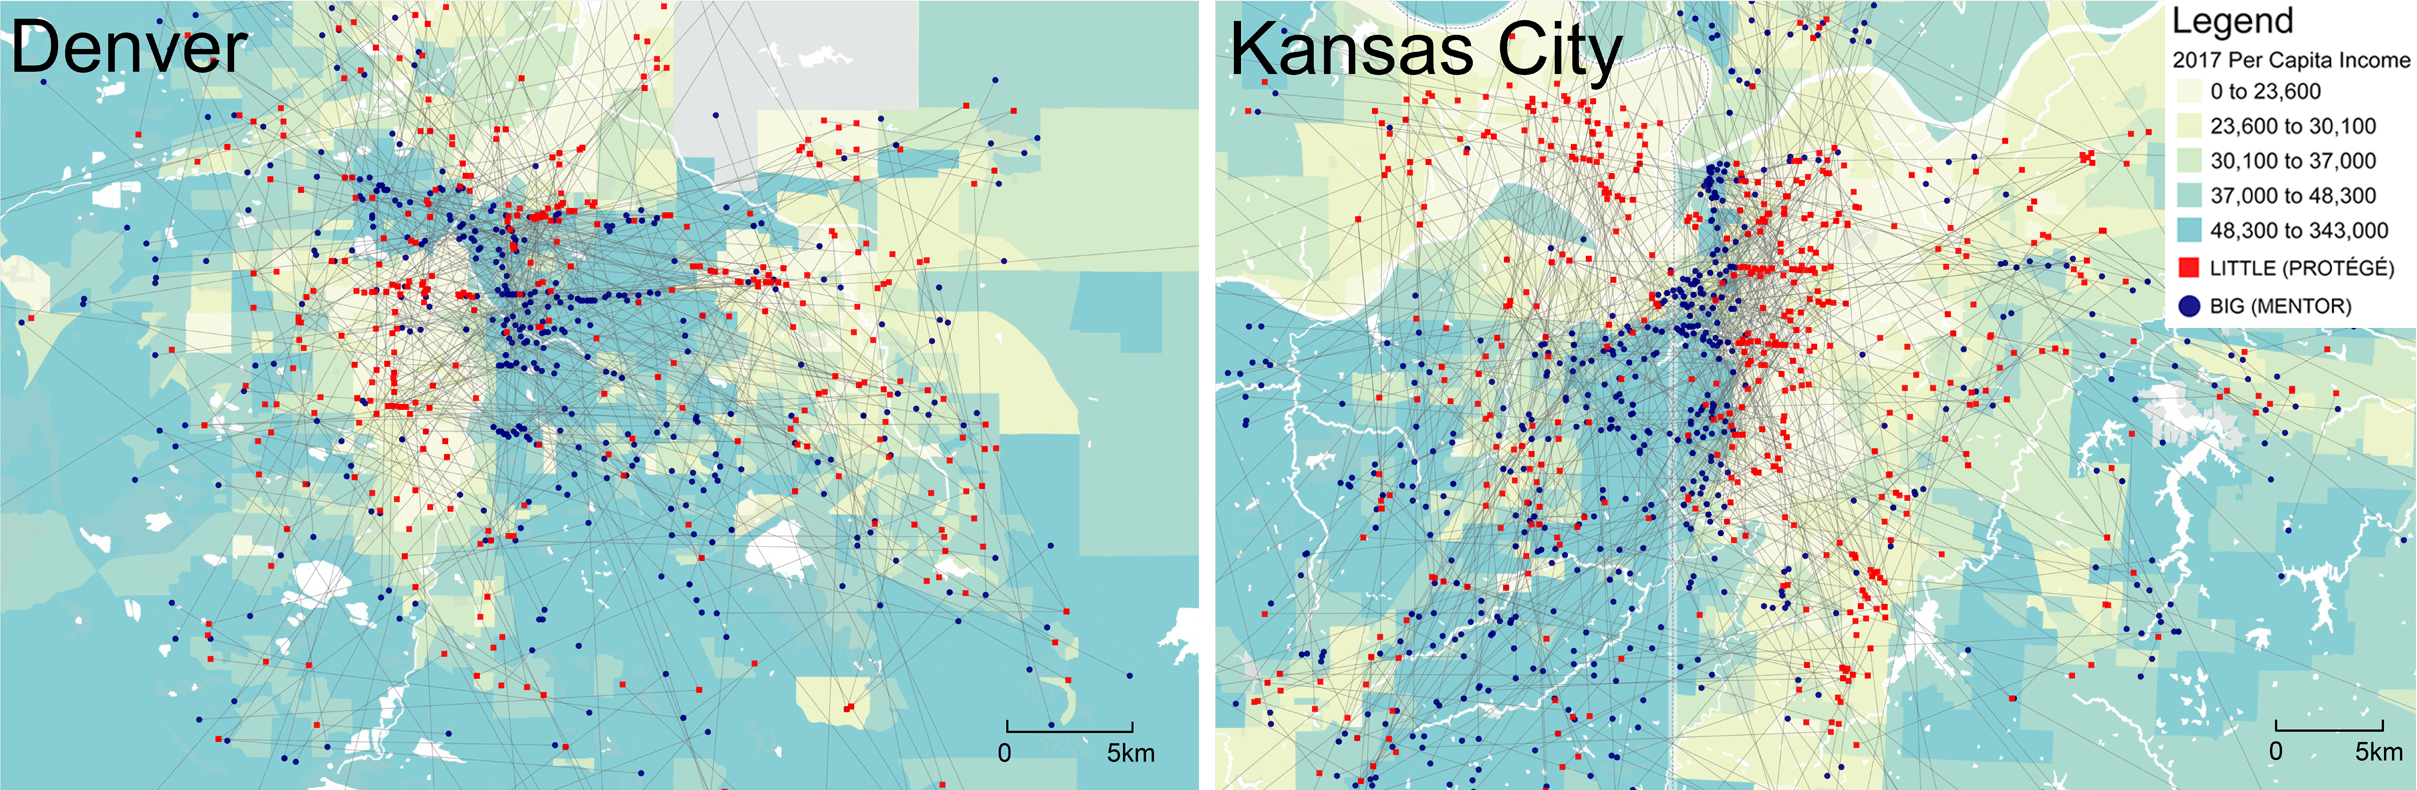
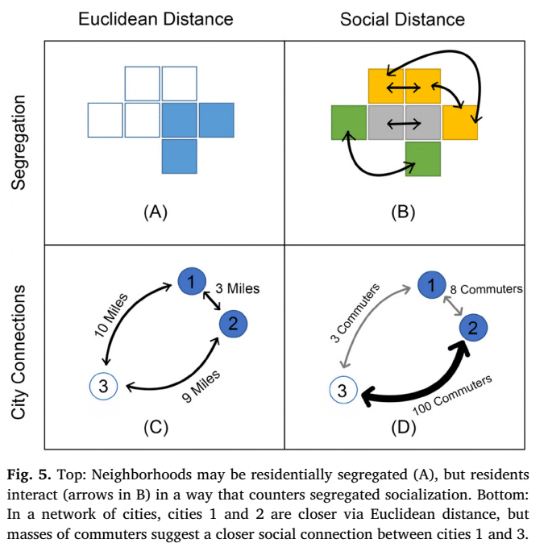
Through a partnership with Big Brothers Big Sisters (BBBS), we model geolocated mentorships as personal day-to-day interaction across urban neighborhoods. We use a novel dataset of over 12,000 BBBS “Bigs” and “Littles”, in seven U.S. American cities (Philadelphia, Tampa, Kansas City, Dallas, Houston, Denver, and Los Angeles). Using statistical tests and GIS, we find that “matches” live closer than simulated pairs. Despite being geographically close, matches create socio-economic bridges. Little neighborhoods have a higher percentage of African Americans and significantly fewer bachelor’s degrees, more unemployment, and lower median household income than Big neighborhoods. Neither matches nor simulated pairs align with the network of urban commuting patterns. We also find that Bigs hail from inner-city areas, suggesting civic engagement and ‘giving back’ of (often young) adults who choose to live in the city.

Results suggest that social-capital-facilitating organizations create a spillover effect by facilitating bridges between neighborhoods and disconnected social networks, benefiting the larger city. This work can help inform research in geography, city science, and sociology and advance the quantitative study of economic social systems within the urban environment.

Poster Winner, Urban Geography Specialty Group Poster Competition: Understanding the 21st Century City,Association of American Geographers Annual Meeting, 2019.

See related paper at: Andris, C., Liu, X., Mitchell, J., O’Dwyer, J., & Van Cleve, J. (2019). Threads across the urban fabric: Youth mentorship relationships as neighborhood bridges. Journal of Urban Affairs, 1-16. Special Issue Edited by Z Neal and B Derudder.

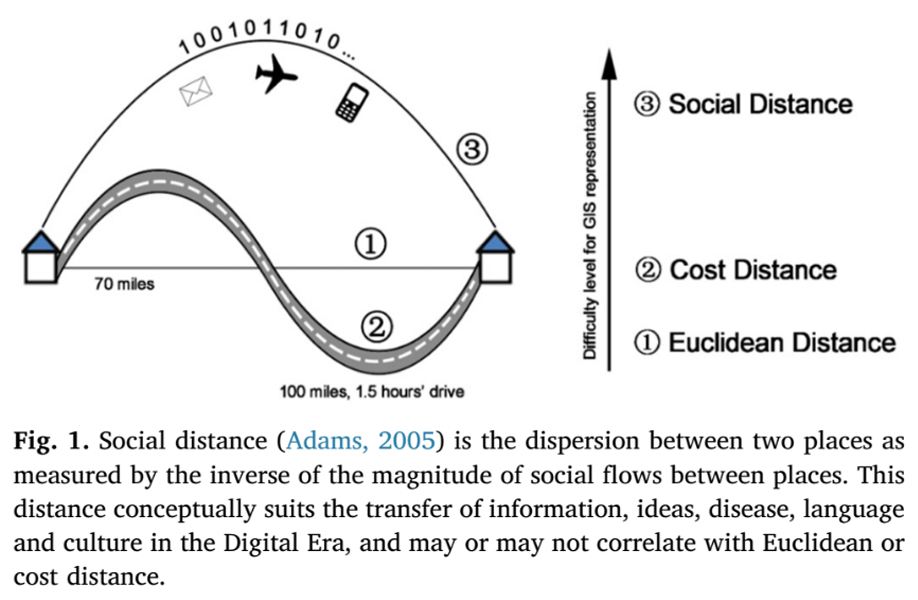
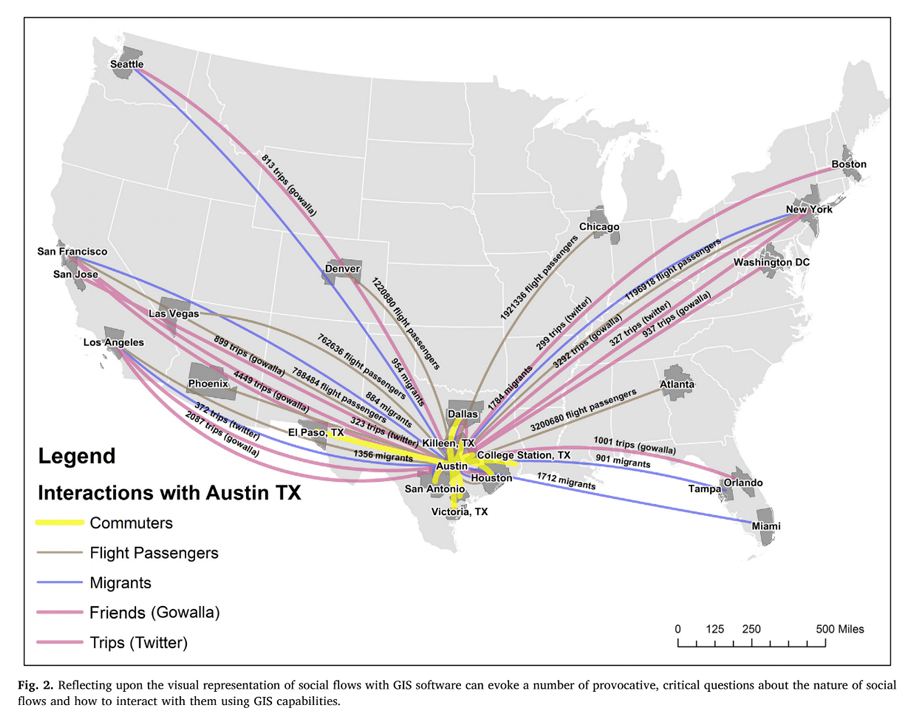
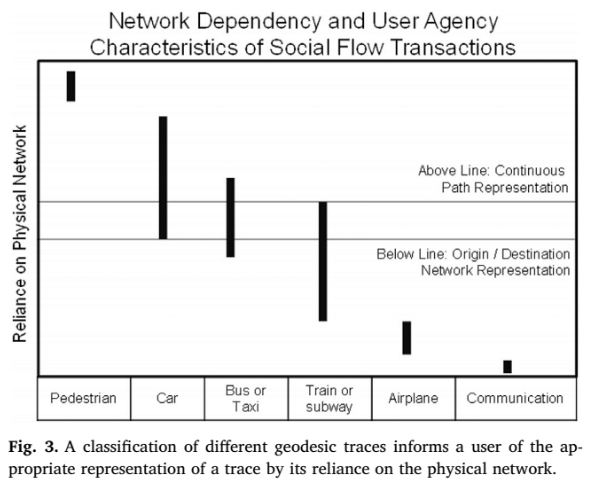
Challenges for Social Flows

The social flow is a linear geographic feature that evidences an individual’s decision to connect places through travel, telecommunications and/or declaring personal relationships. These flows differ from traditional spatial networks (roads, etc.) because they are often non-planar, and provide evidence of personal intentionality to interact with the built environment and/or to perpetuate relationships with others.

We use tons of social flow data in today’s research, and so, we create new typologies, address new problems, and redefine social distance as the manifestation of social flows. We describe challenges for leveraging these data with commercial GISystems in terms of representing, visualizing, manipulating, statistically analyzing and ascribing meaning to social flows.

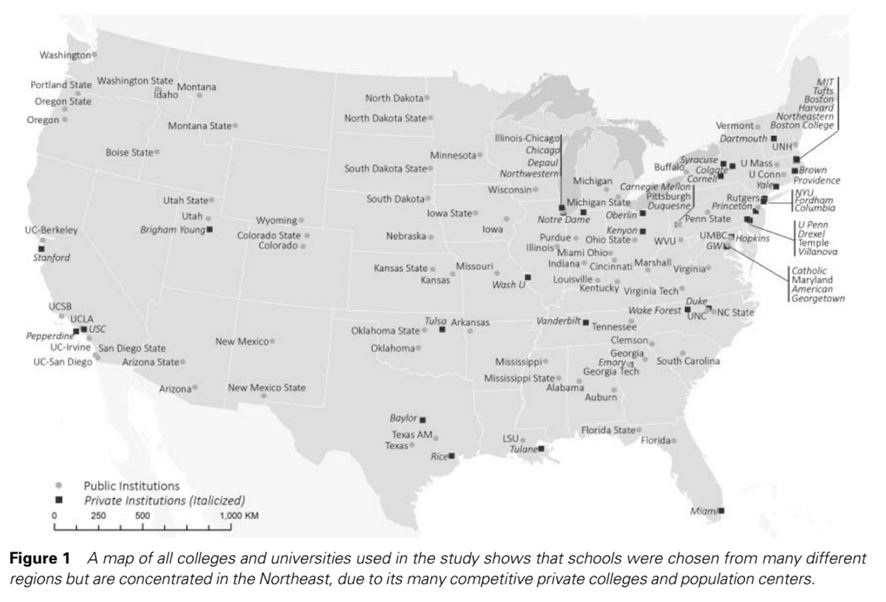
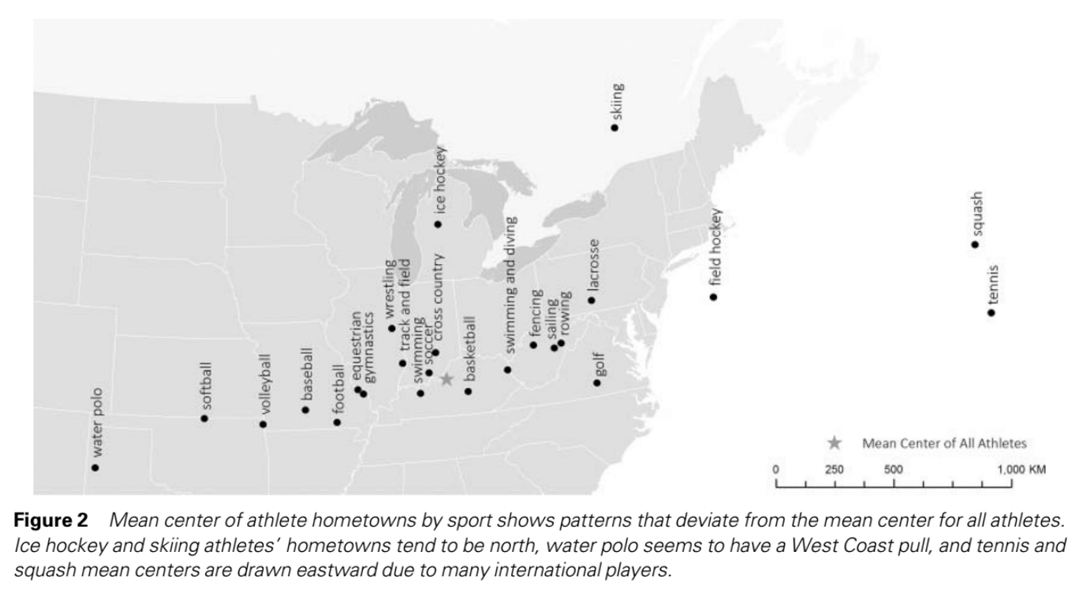
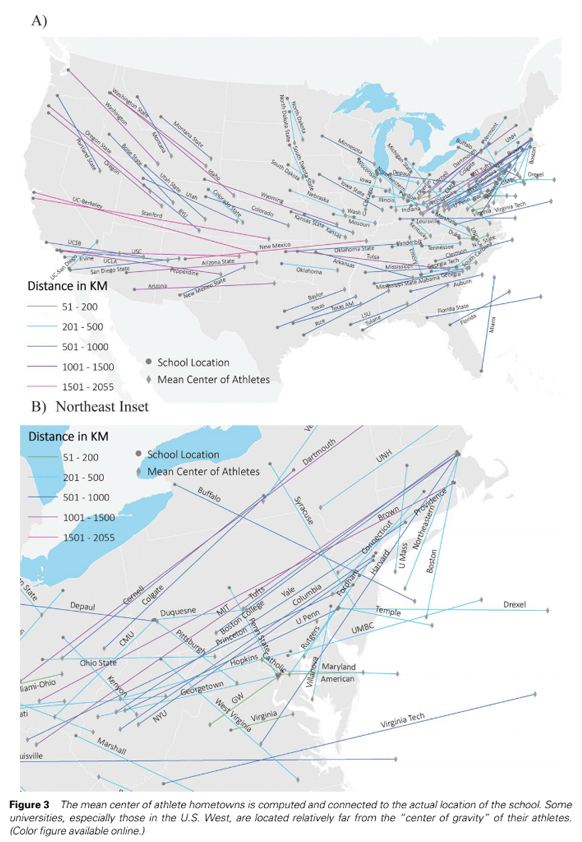
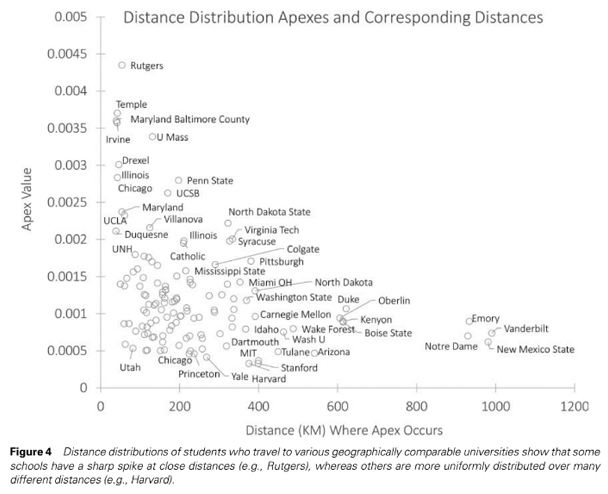
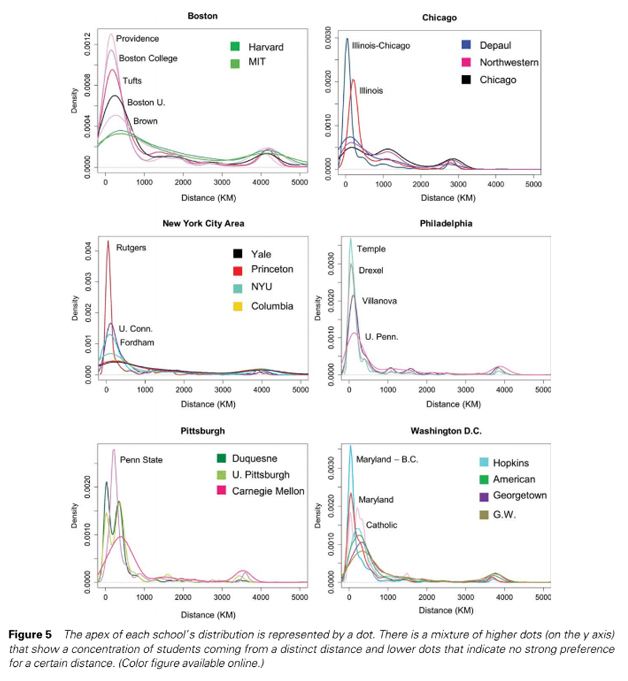
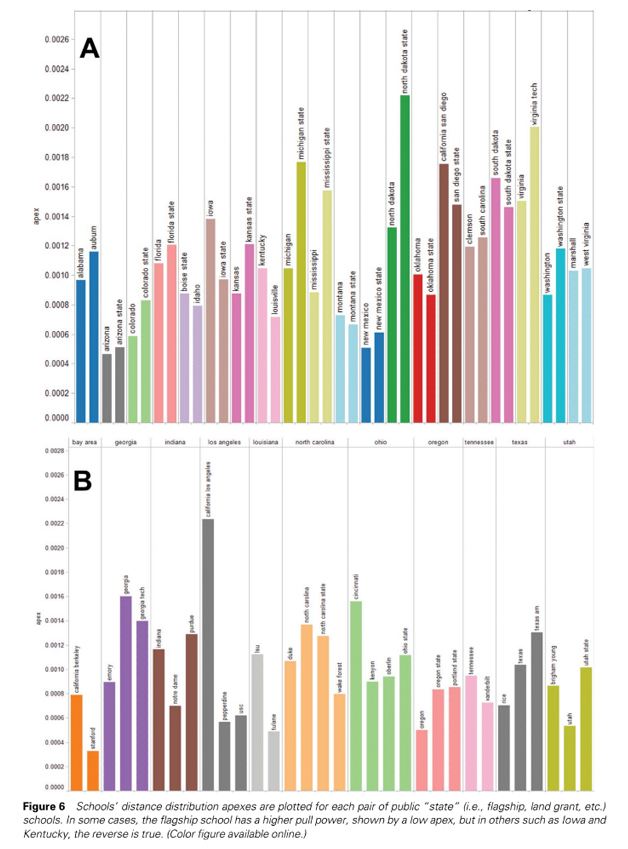
Measuring Geographic Pull Power: A Case Study of College Athletics

Student athletes increase the diversity of schools. Which universities draw students from distant and diverse locales? We put together “pull power statistics” for 160,000 student-athletes from more than 1,600 university team rosters at 128 schools over various years. Stats include mean distance traveled, count of unique hometowns, percentage of international student-athletes, and a new distance decay “apex” method to rank schools by their pull power. Western U.S. (like U. Idaho and U. Arizona) and private schools (like Harvard) lead the ranks. Schools like Rutgers, Catholic University, UMBC and U. Illinois-Chicago have a lot of local student athletes.

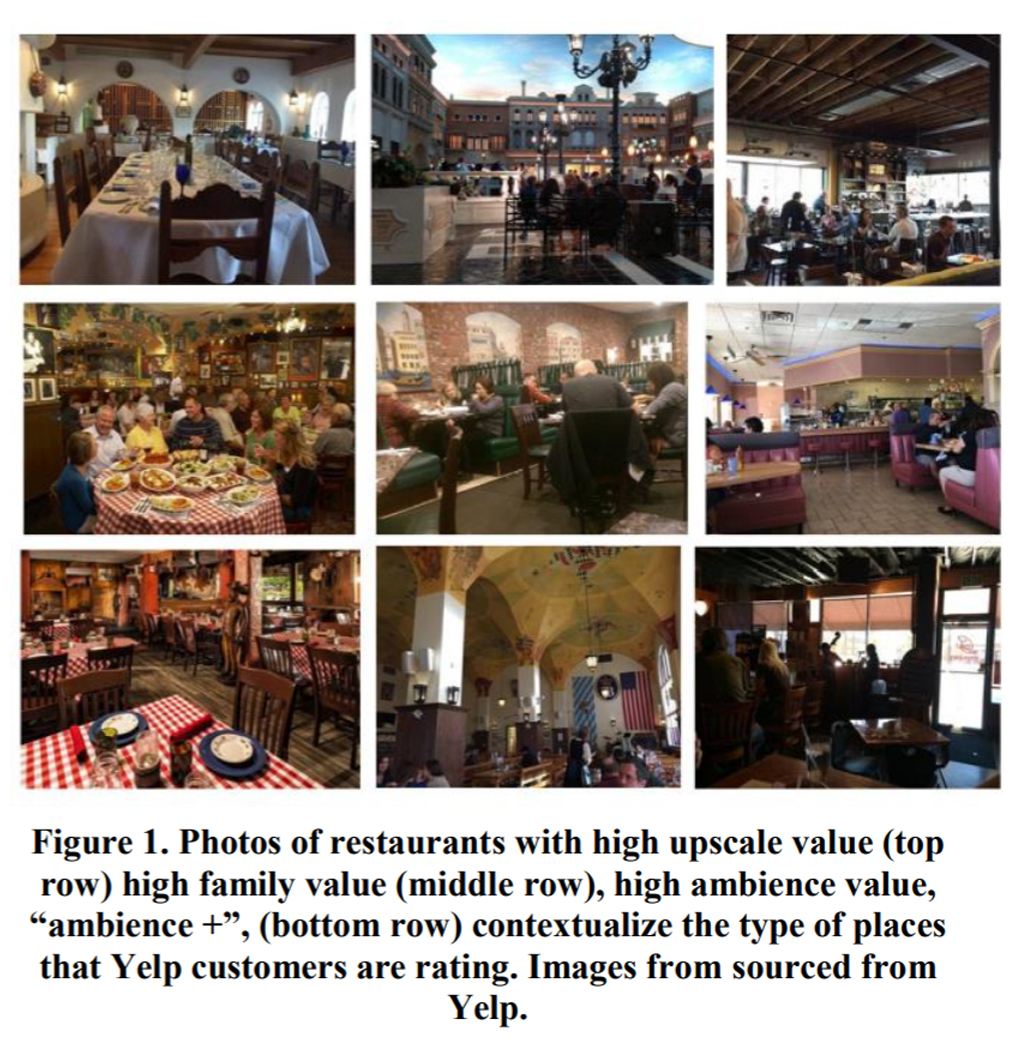
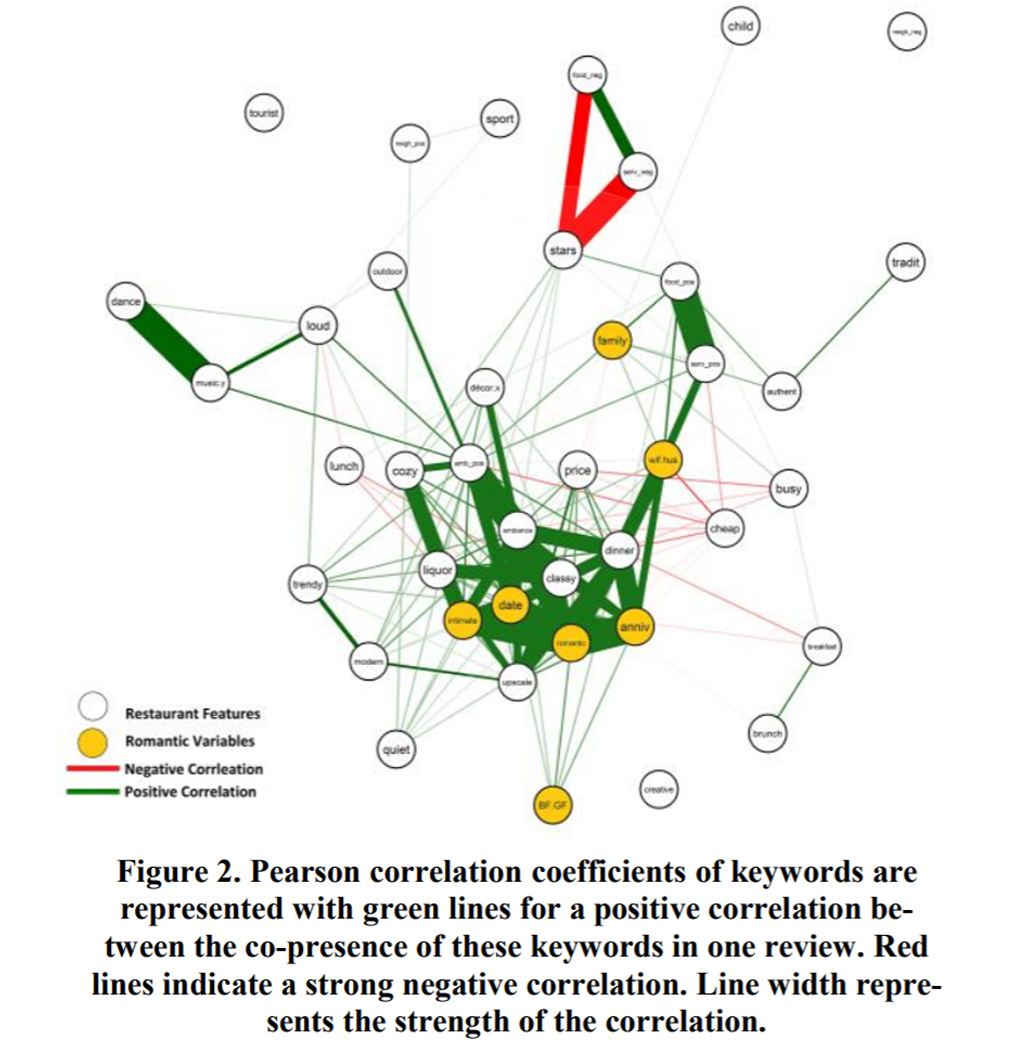
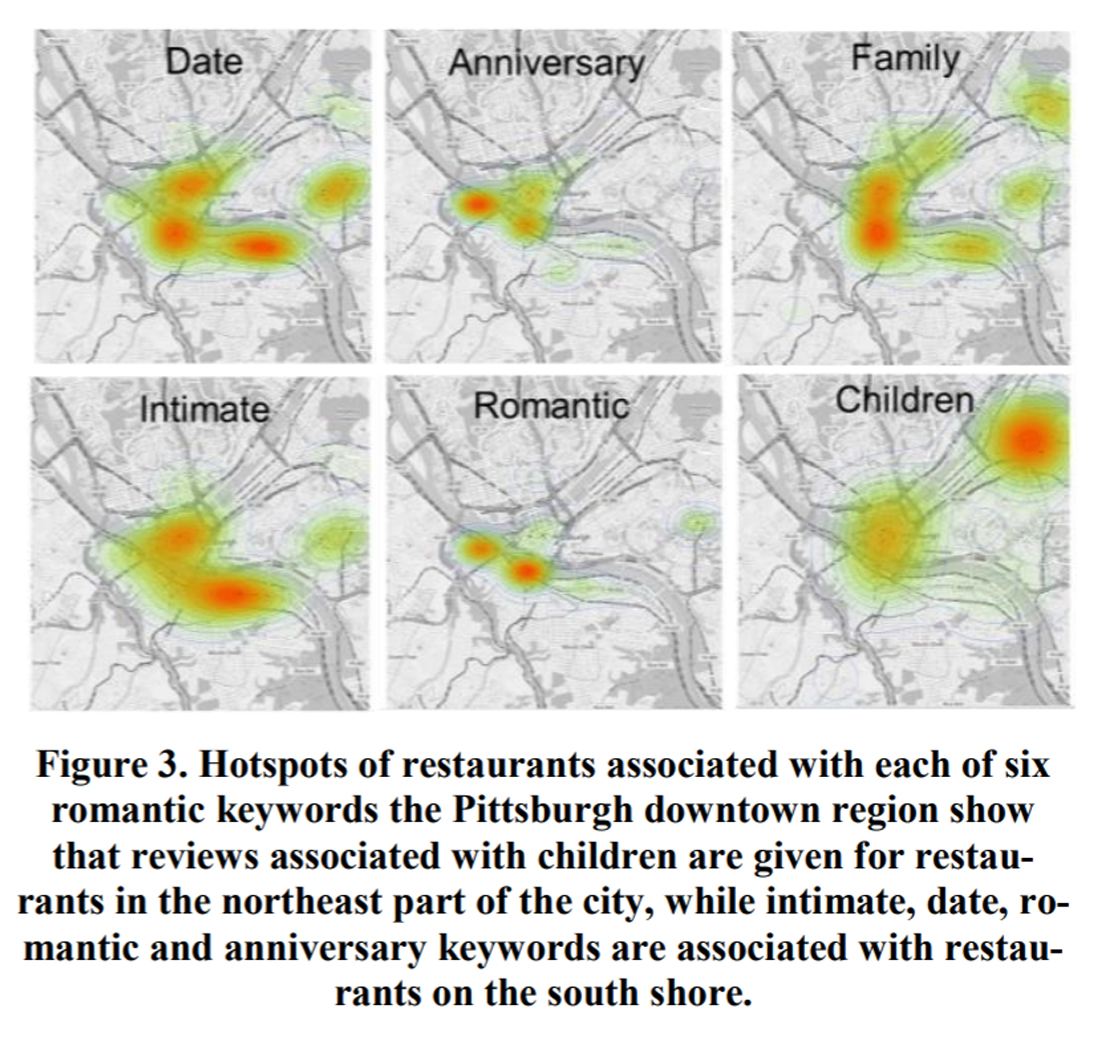
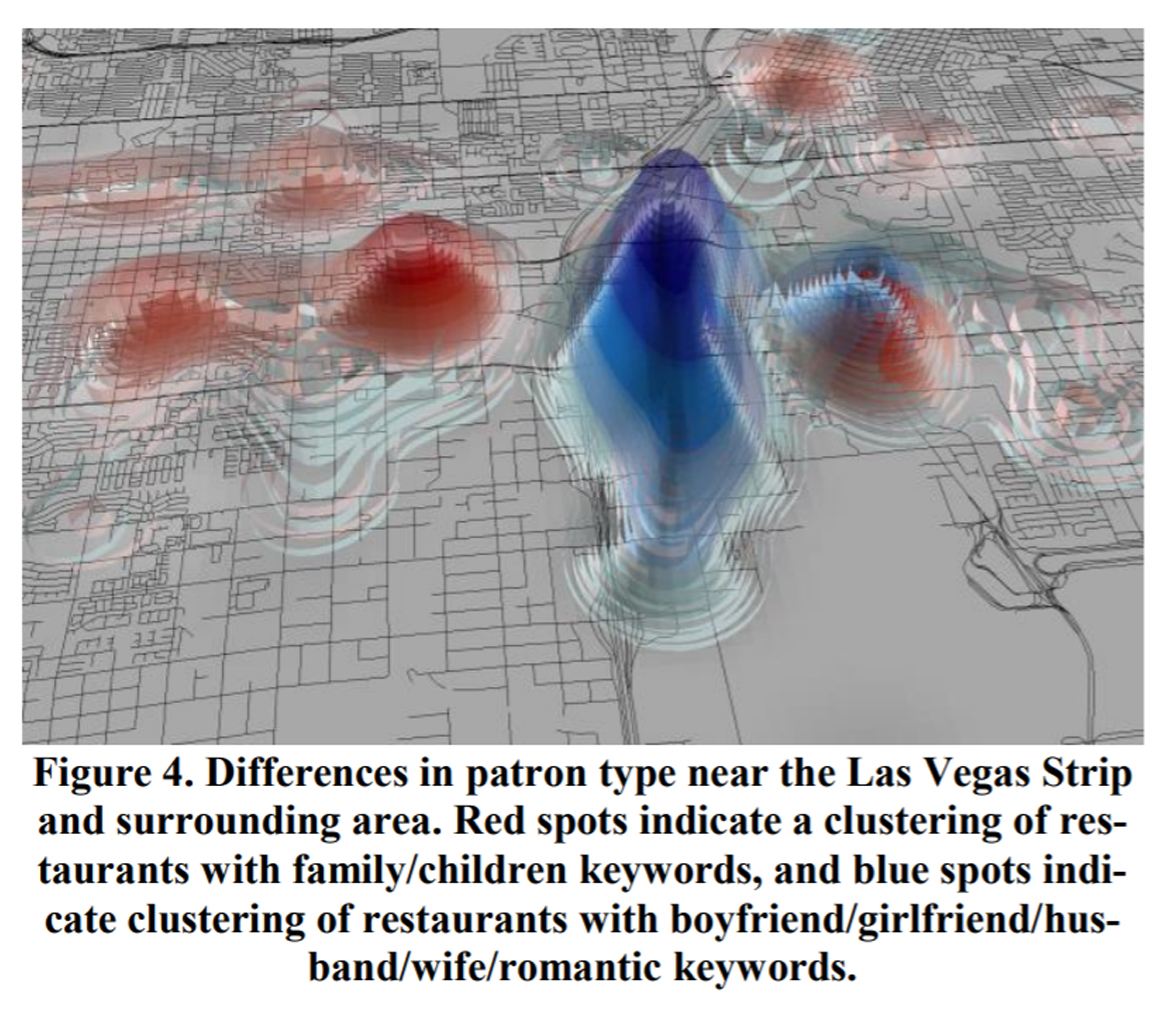
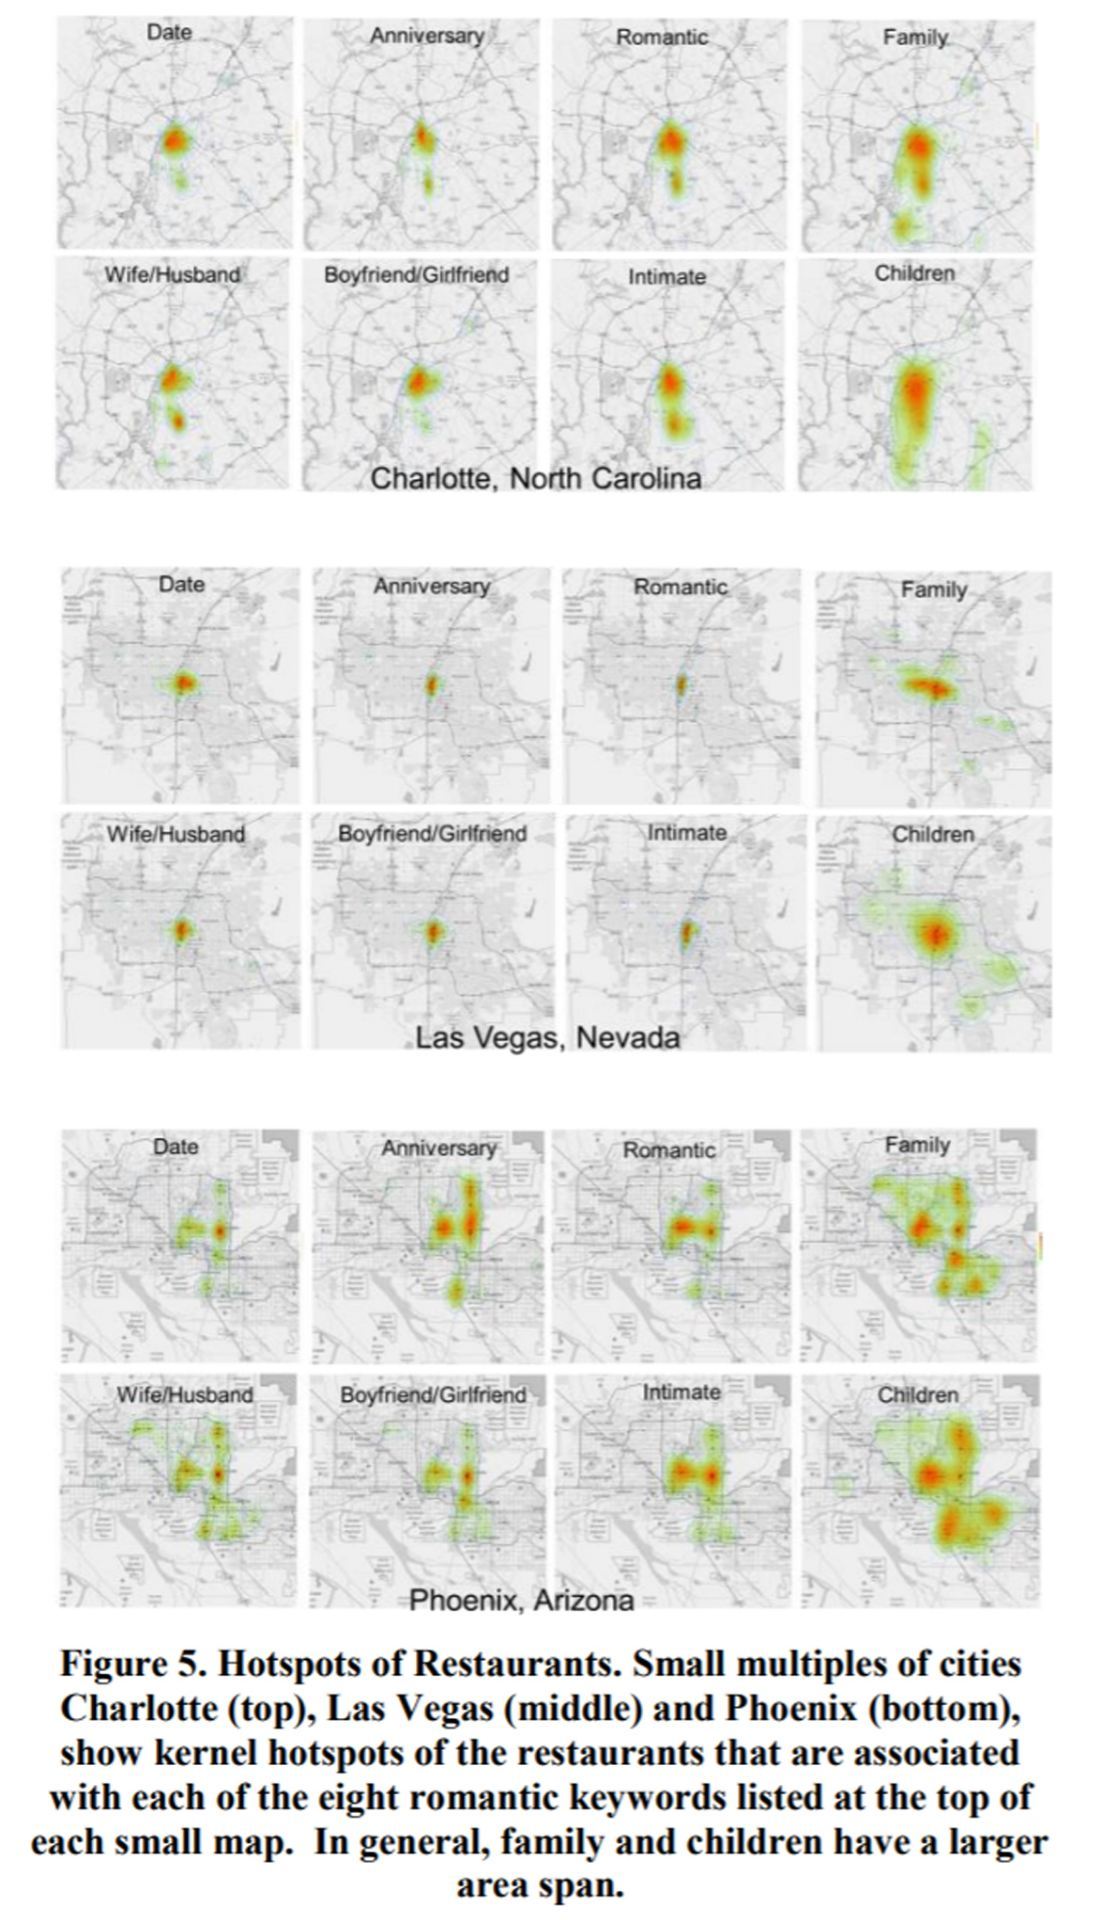
Using Yelp to Find Romance in the City: A Case of Restaurants in Four Cities

Findings: There’s a certifiable difference in urban hot spots and demand depending on couples’ relationship stage. Key factors for selecting a romantic date spot include ambiance (cozy & classy atmosphere), high prices, and downtown locations. Couples with families (children) tend to prefer less expensive restaurants, with great service and (probably) accessible parking. Special occasion locations are concentrated in downtown areas, especially for Las Vegas and Pittsburgh, but are more distributed for sprawling cities like Phoenix and Charlotte.

Method: Natural Language Processing of Yelp reviews to scan for correlations of certain keywords, cross-referenced with locations of restaurants.

Good For: If you are opening a bar or restaurant and would like to influence the potential clientele, or if you would like to glean insight into the romantic life cycle.

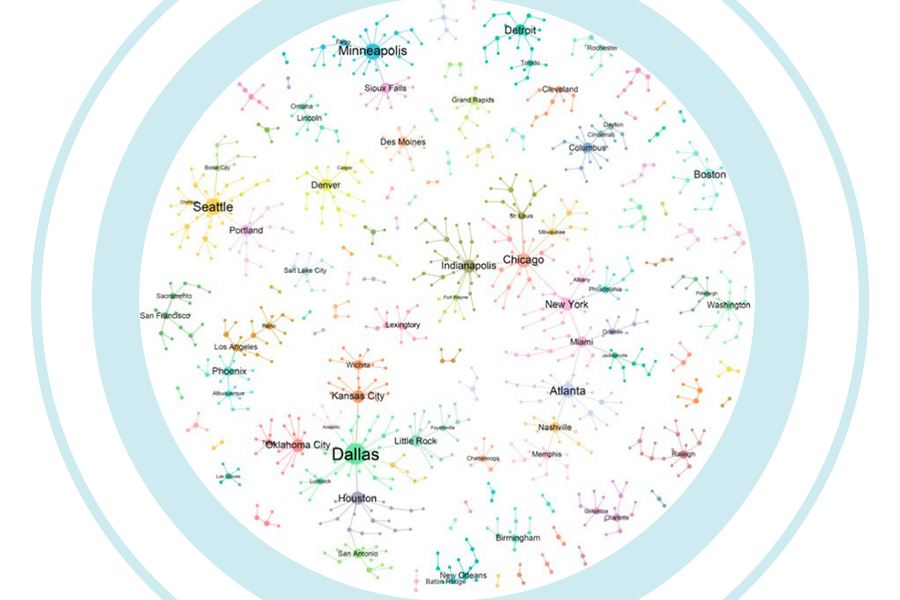
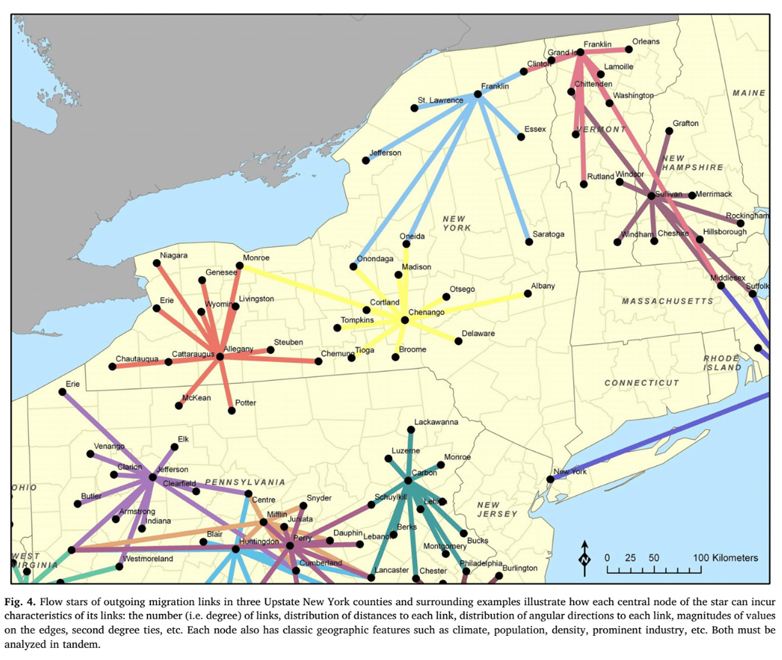
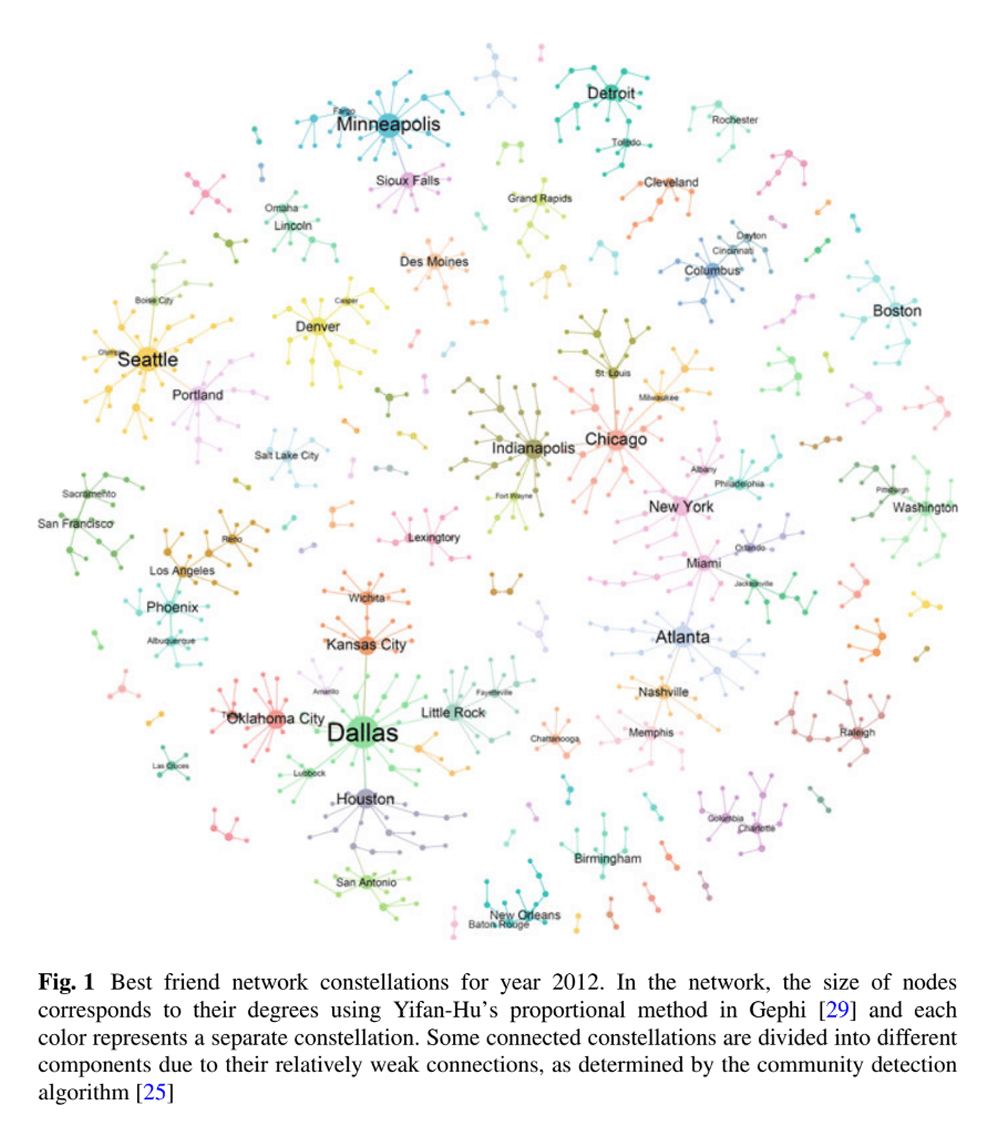
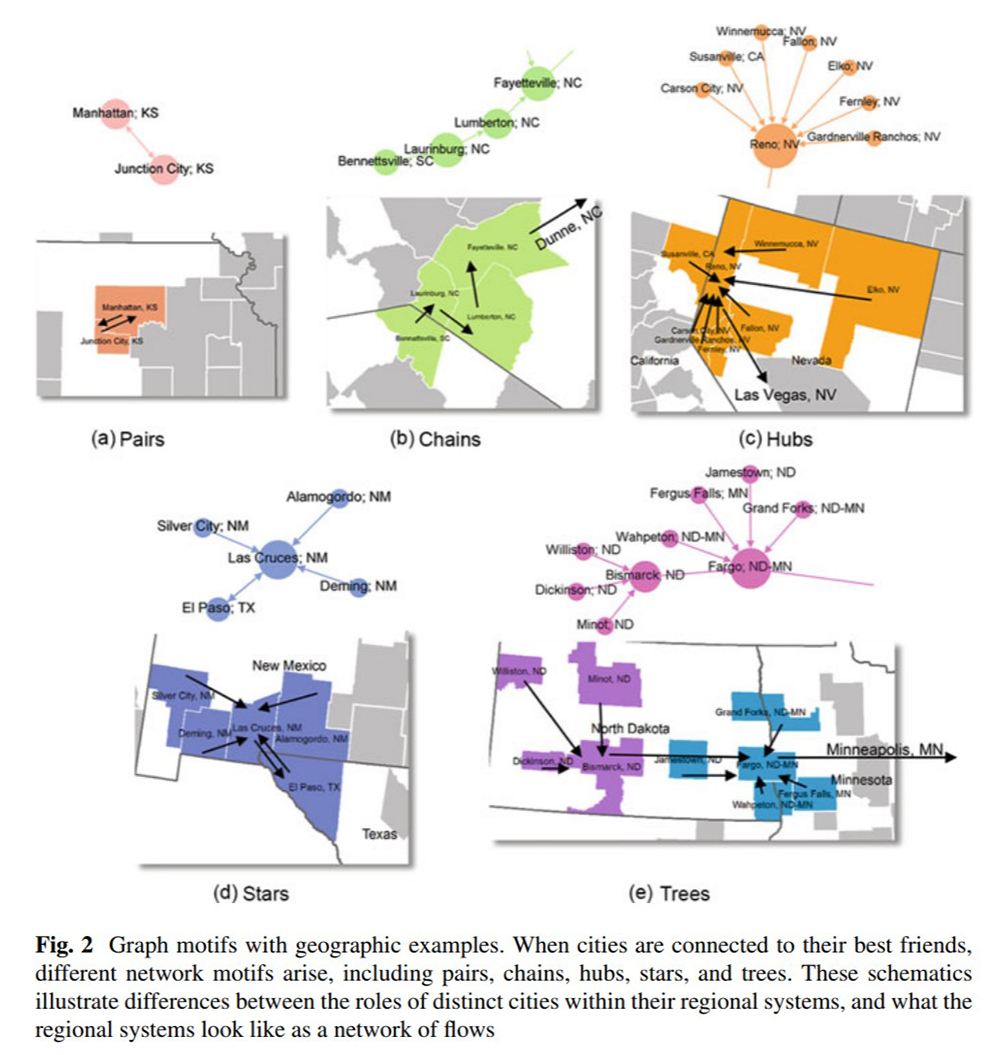
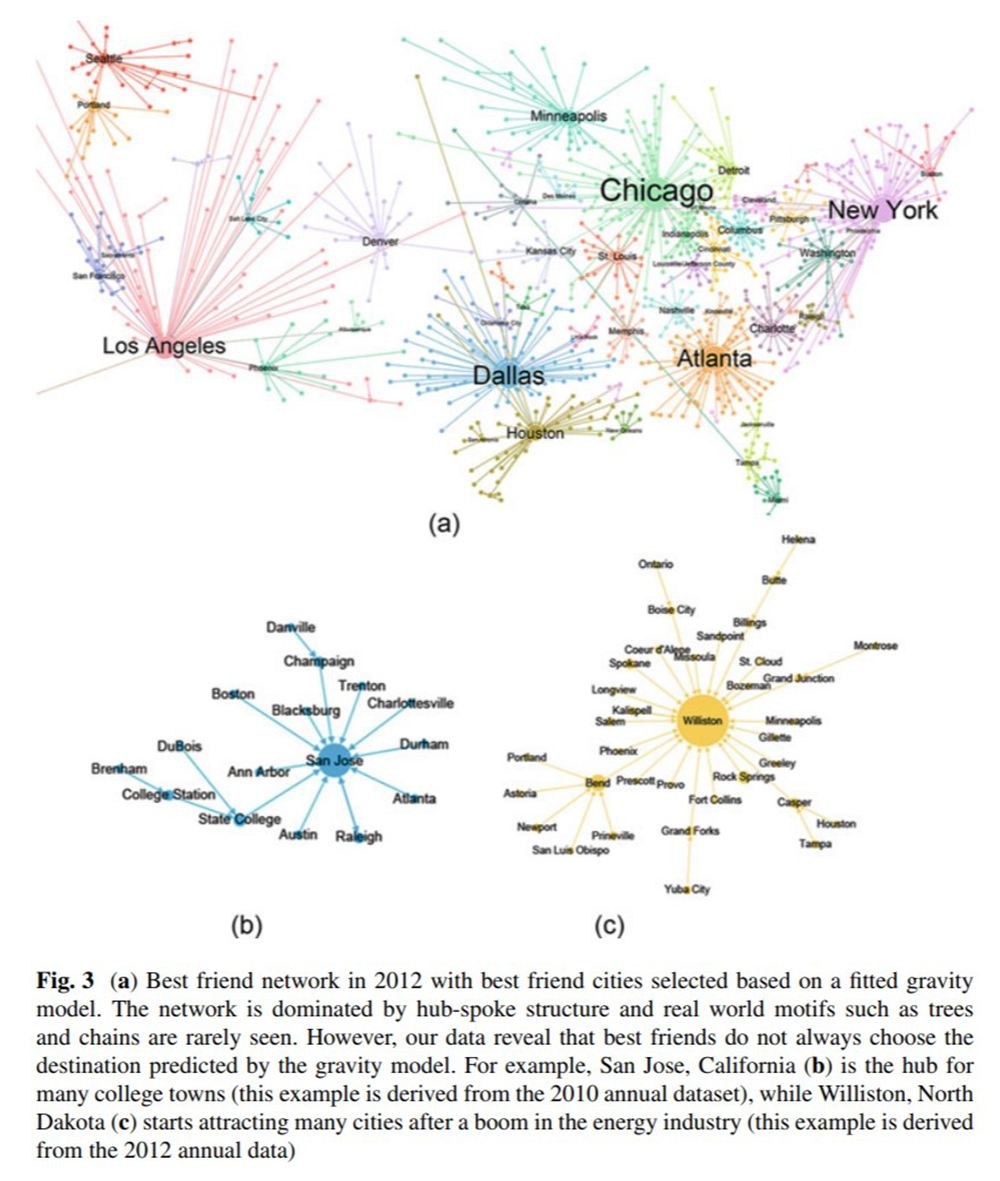
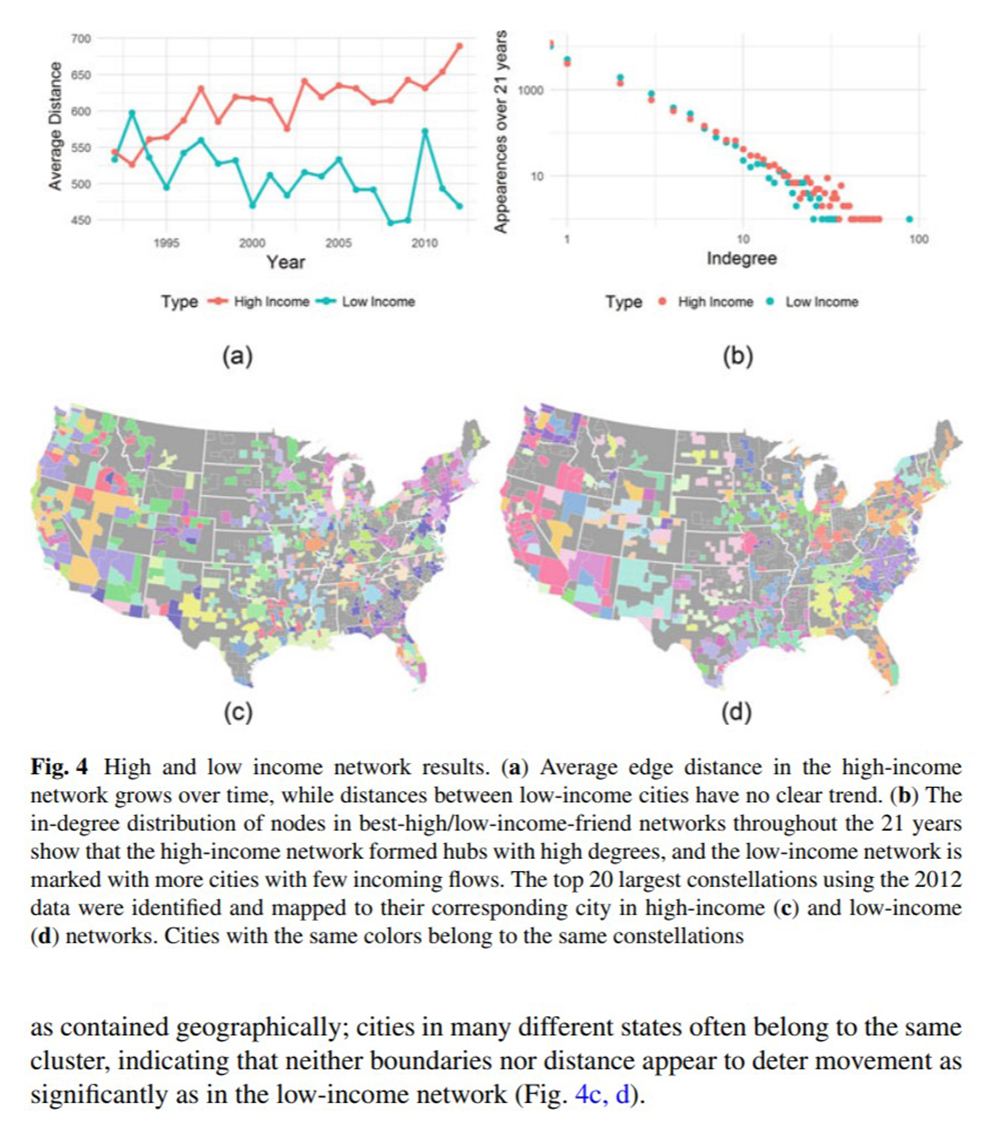
Wealthy Hubs and Poor Chains: Constellations in the U.S. Urban Migration System

Findings: Geographically isolated, large cities (like Dallas and Phoenix) tend to receive the most migrants from other US cities. Destination cities turn over regularly over time. The overall diversity of destinations (bag-of-cities) for migrants is decreasing despite the rise of mobile technologies, i.e. migrants now have ‘hot spots’ that they go to, instead of a distributed set of options like in the early 1990s. We find this counter-intuitive, as the Internet makes it easier to search for new jobs and housing in distant places. Poorer migrants tend to follow chains of nearby cities, while richer migrants create a hub and spoke network, where the hubs are often retirement areas in Florida like Cape Coral.

Method: Mapping US migration flows in constellations, assigning nodes and edges to cities, and charting changes based on 20 years of IRS data at the MSA Level.

Good For: If you would like to learn more about where a population of a given city lived previously, or if you are interested in predicting where people will go. Any business marketing to transplant demographics. Guide to using graph theory motifs for urban networks.

Measuring Attraction and Redistribution of Institution-Based Movements

Findings: Penn State draws more students that are closer to the university and come from higher income families. Alumni from large PA cities facing economic downturns return to those cities more often than those from Philadelphia or New Jersey.

Method: Applying clustering and socio-economic modelling statistical methods to measure changes in the Pennsylvania State University’s population draw and redistribution power from 1995-2015, focusing on the U.S. Mid-Atlantic Region.

Good For: If you want to know the geographic composition of Penn State students, which can be useful for marketing to under-represented areas or planning alumni events.

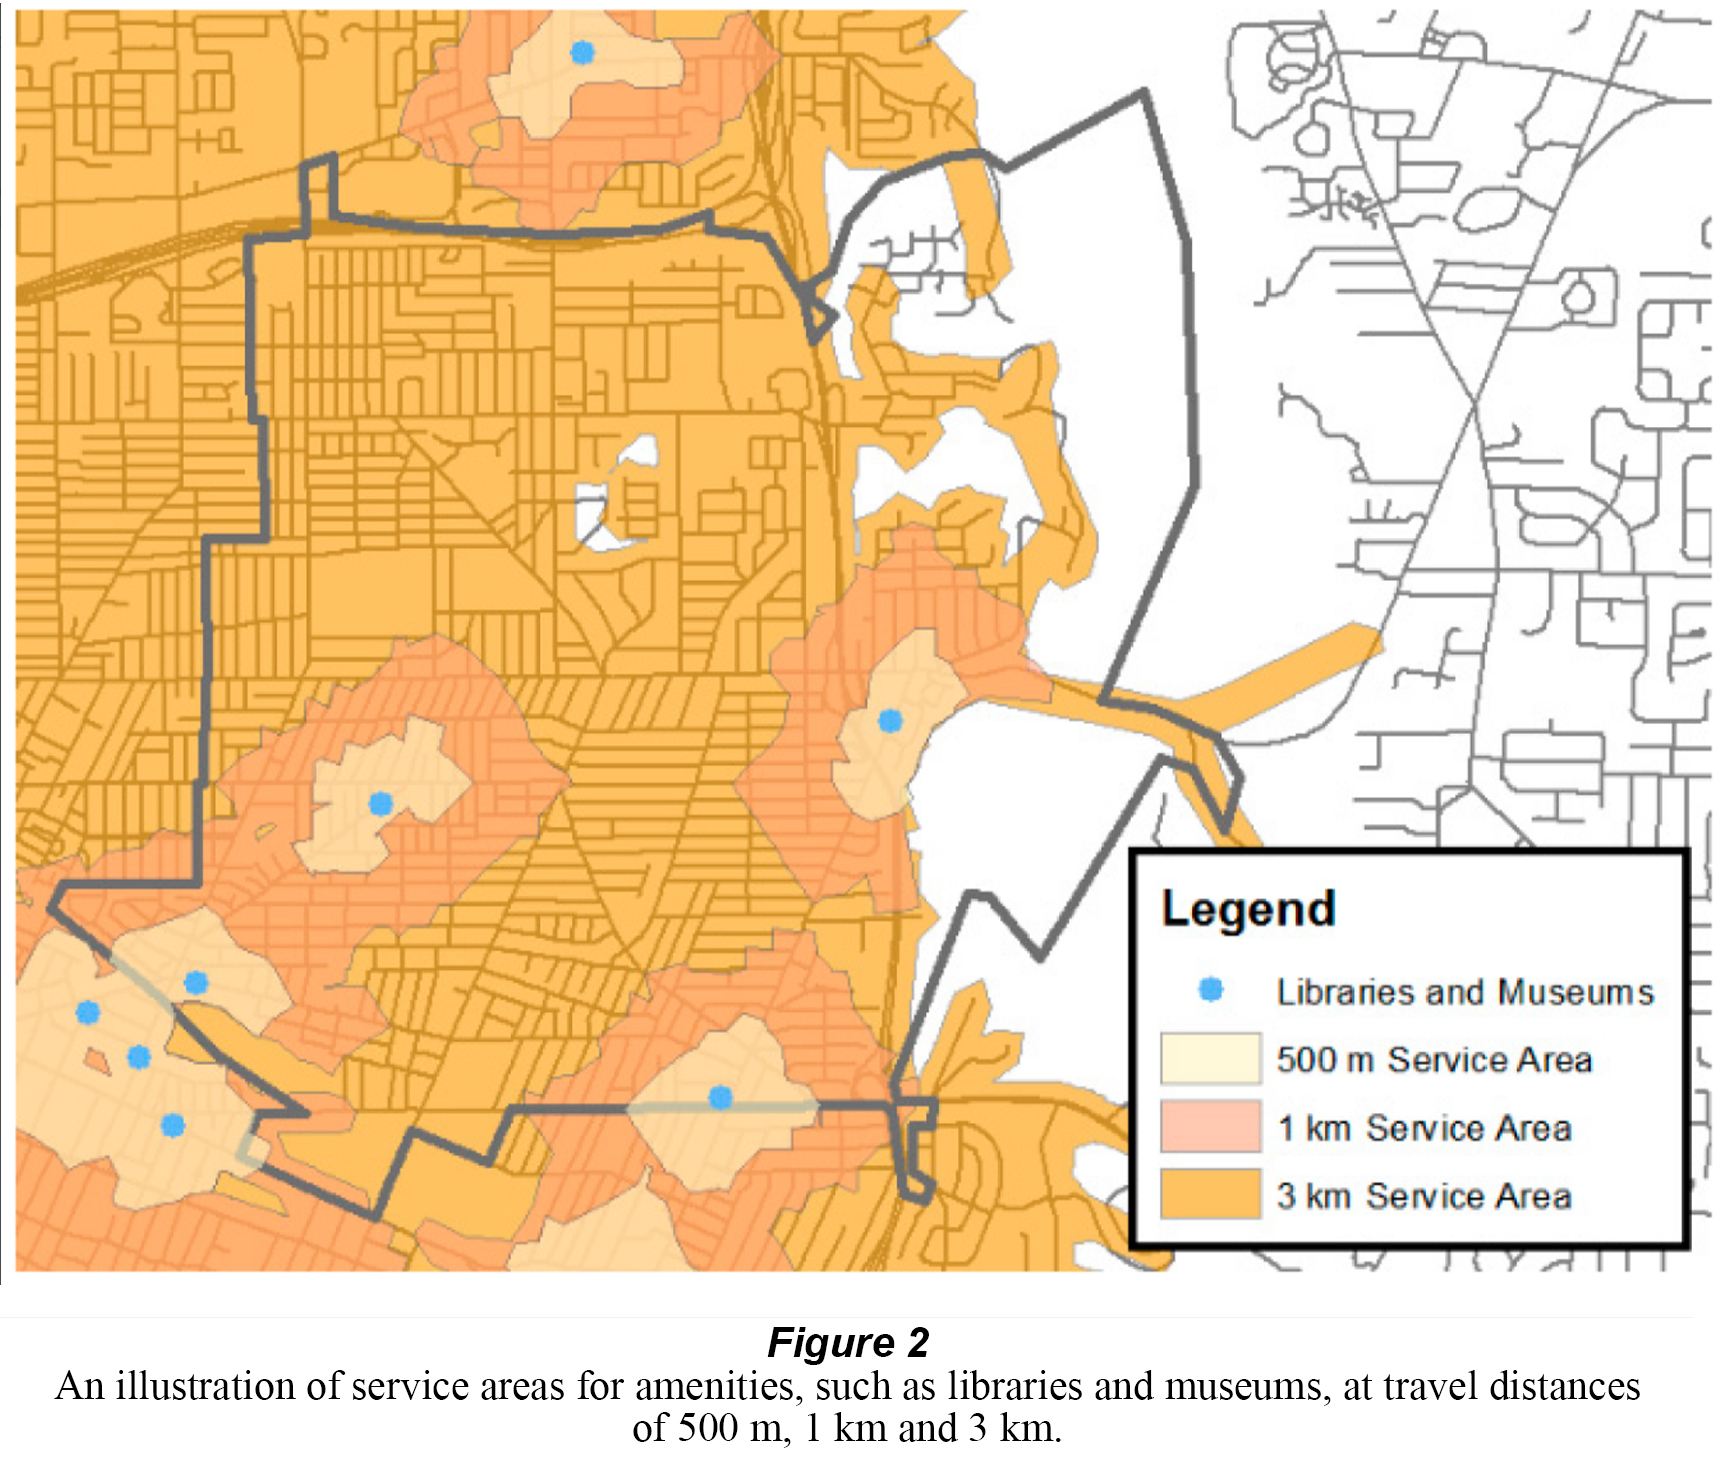
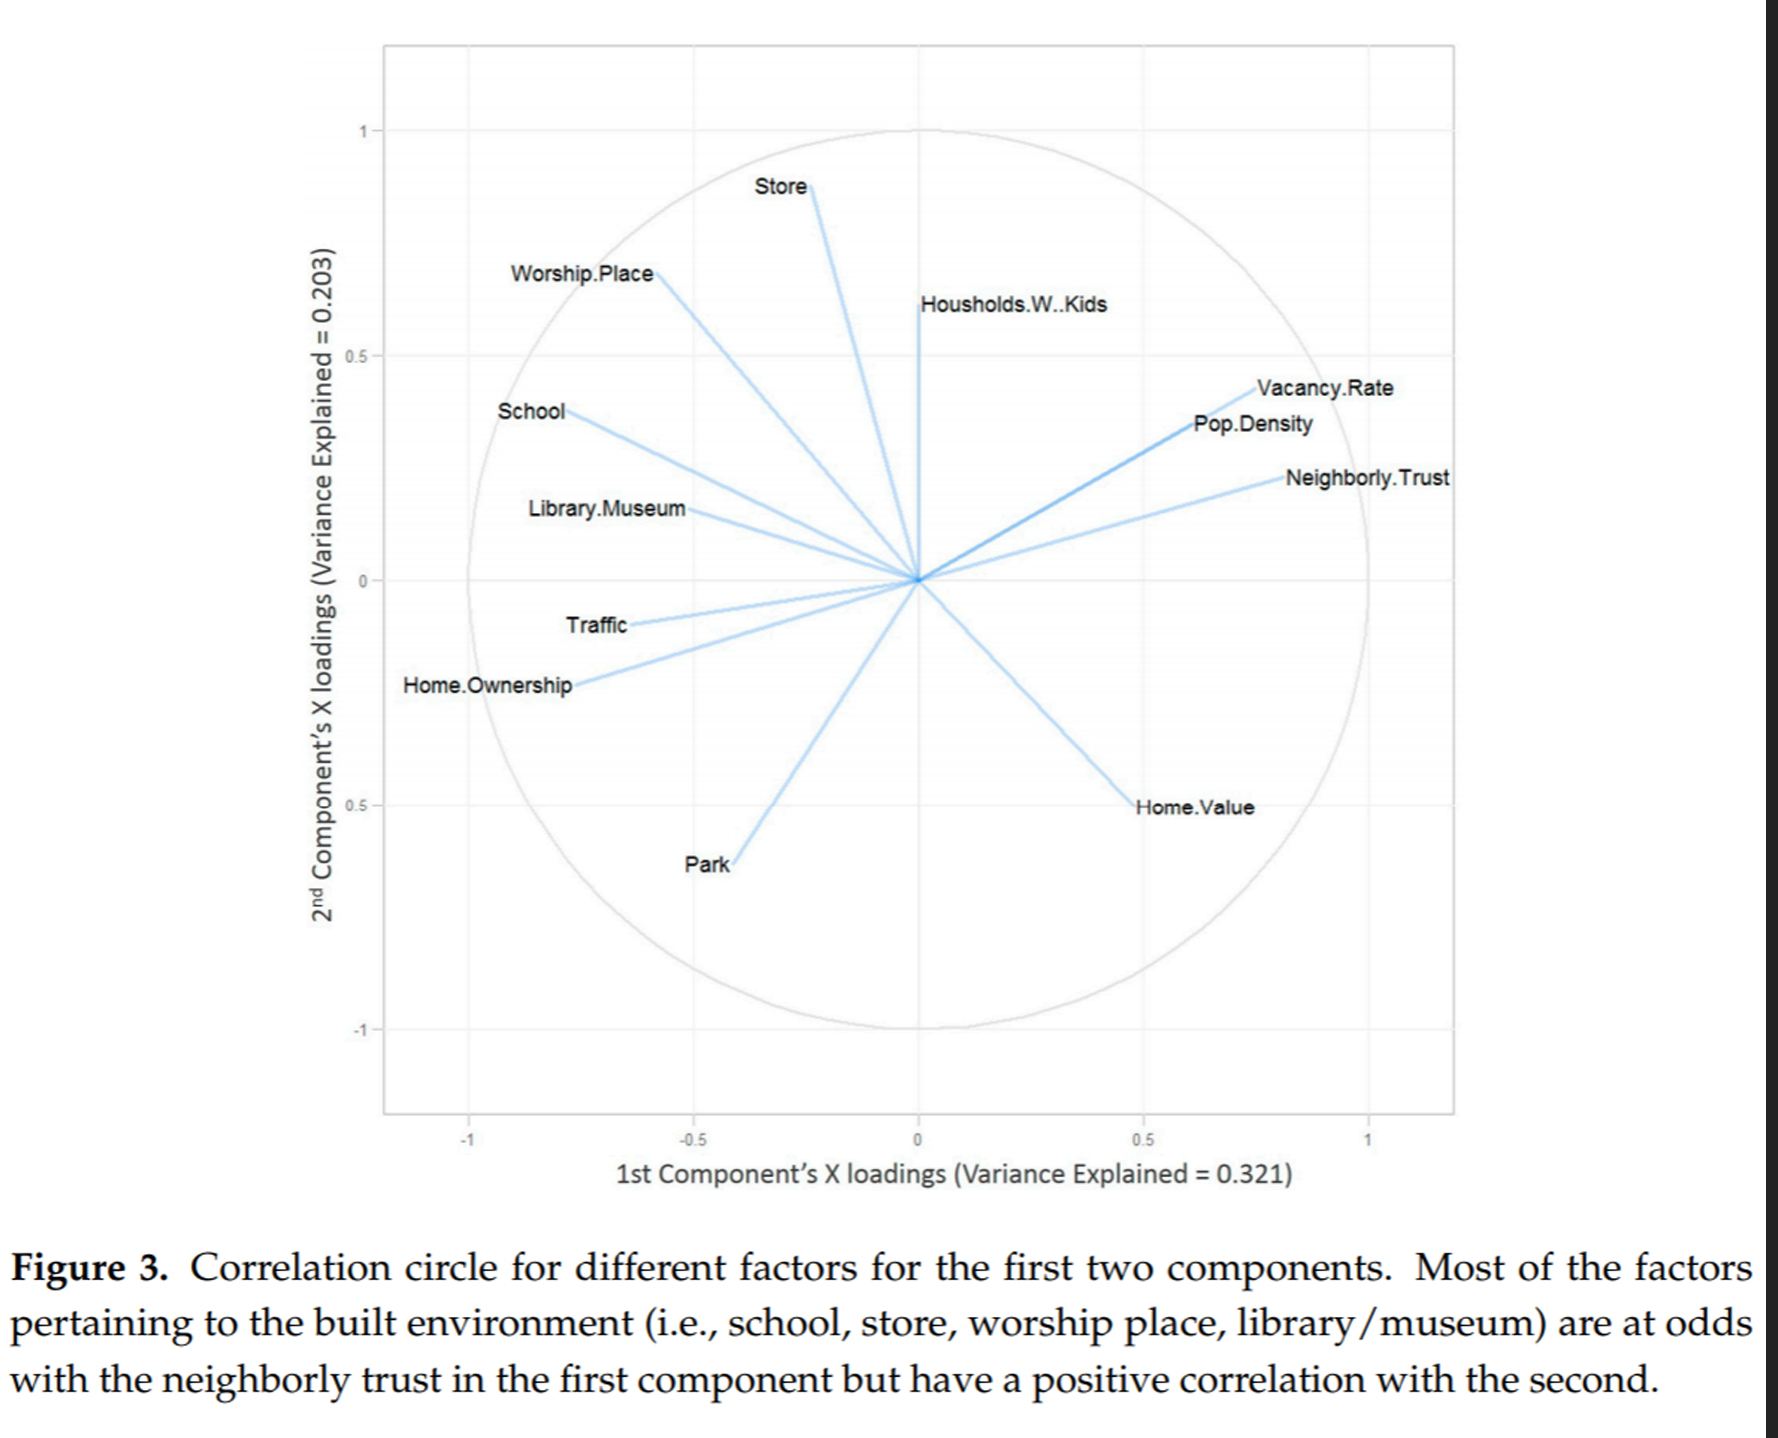
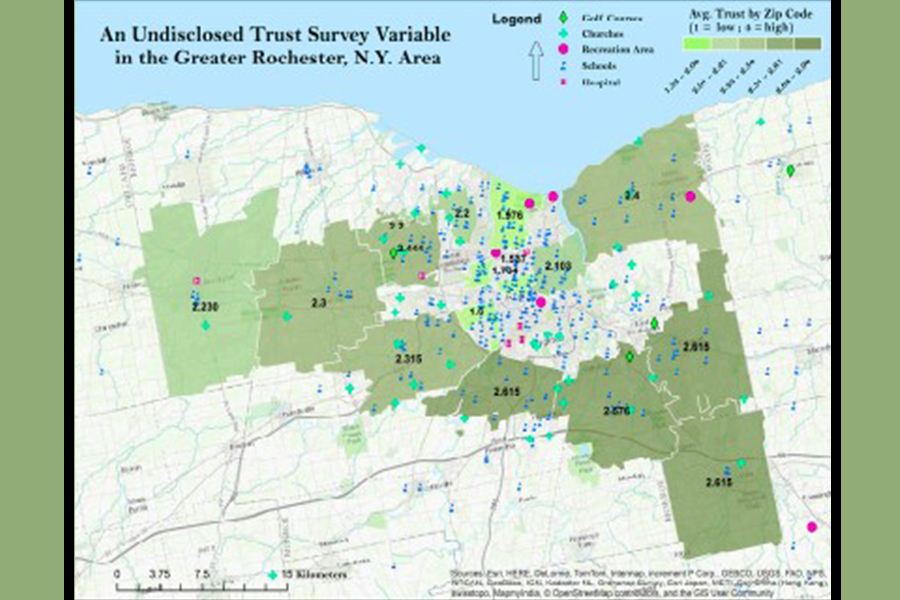
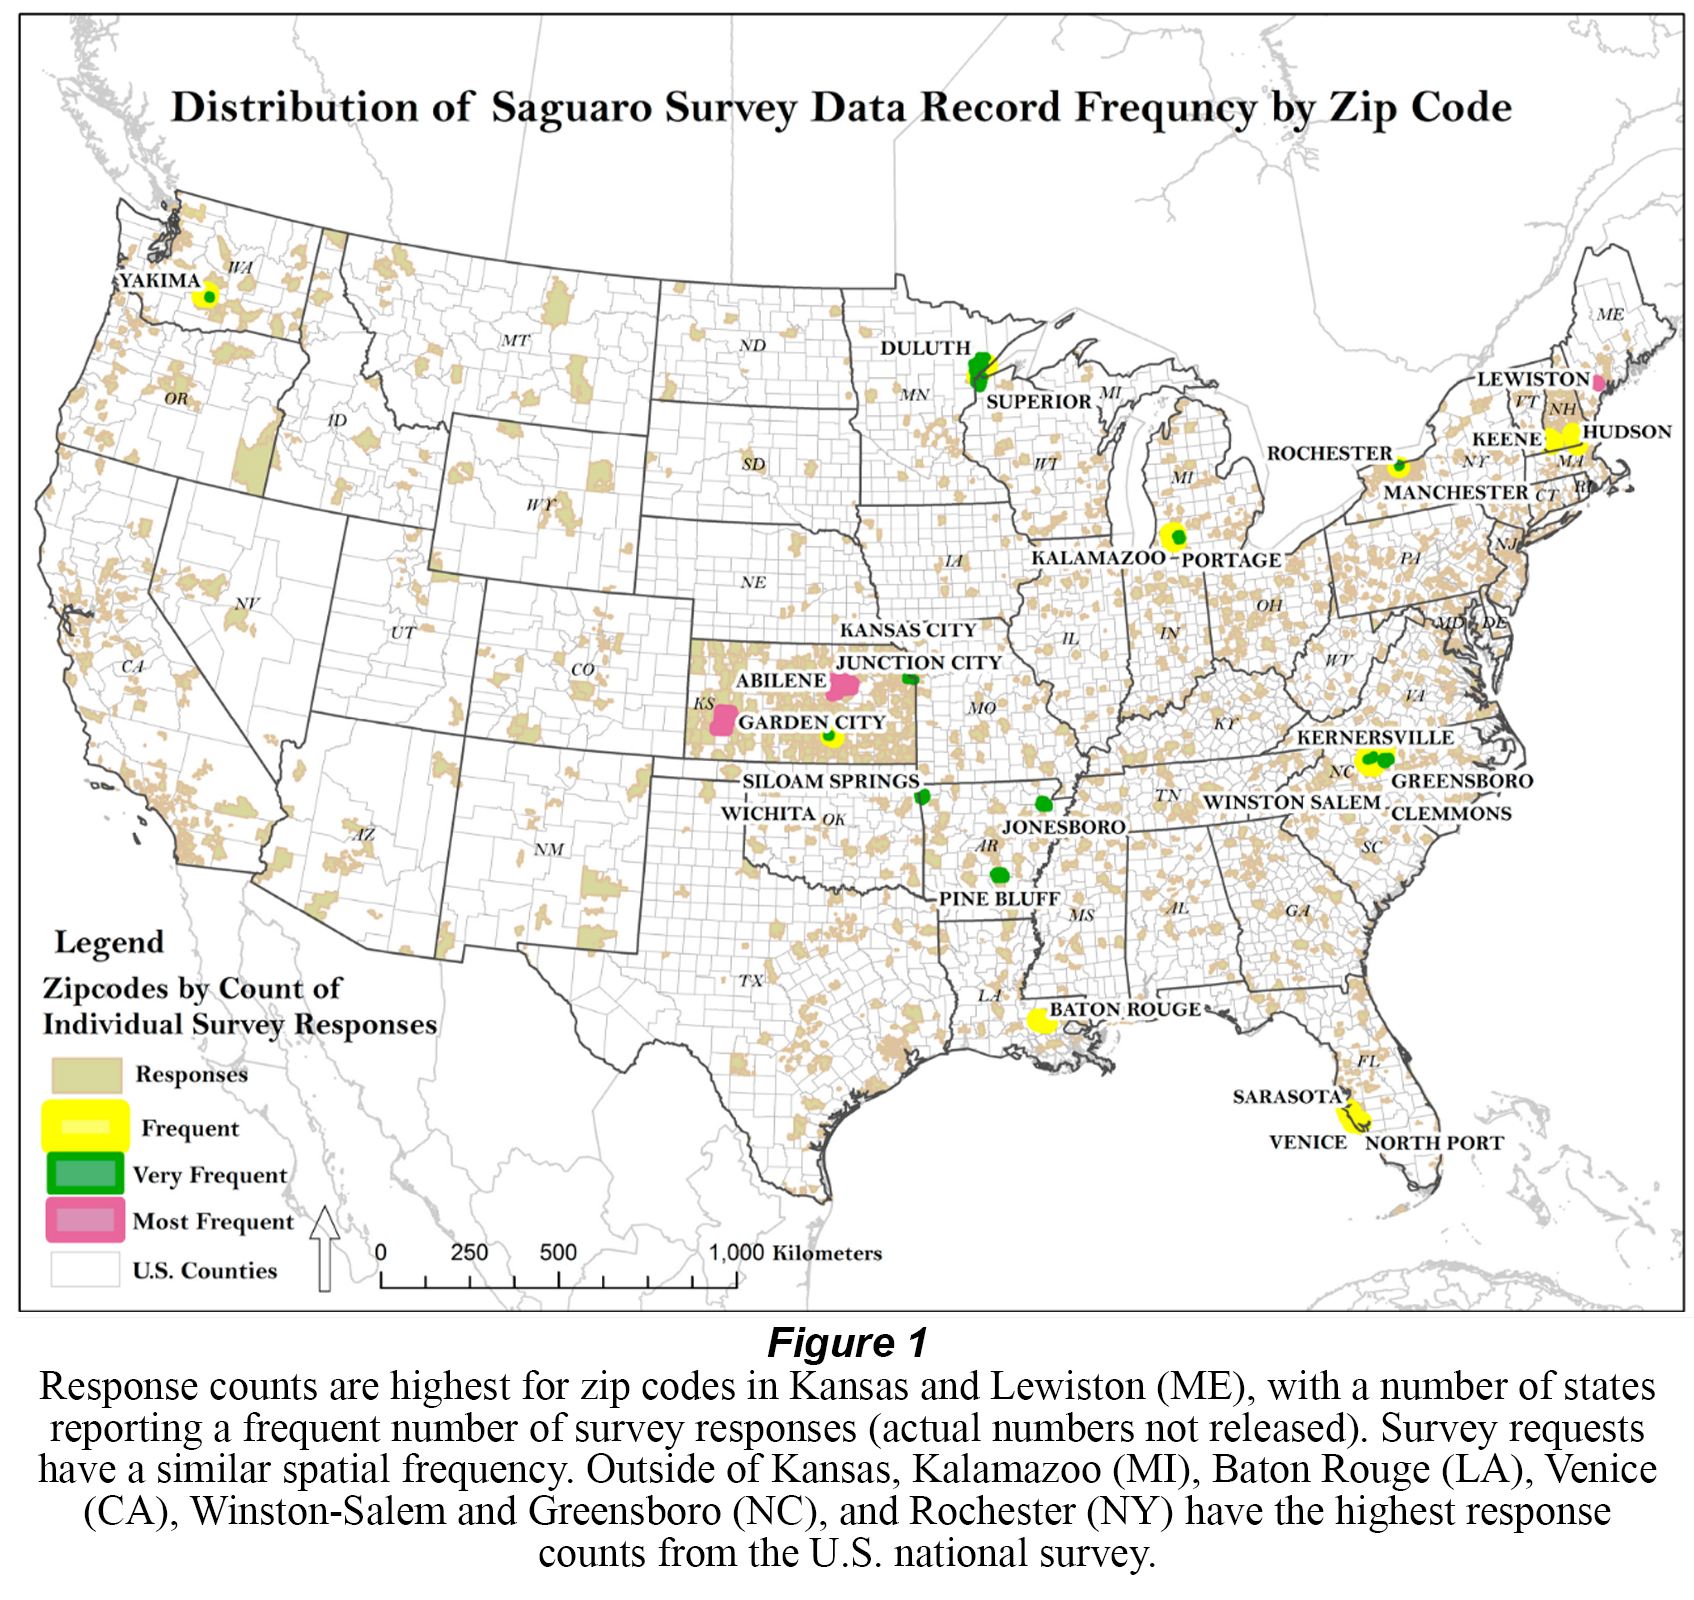
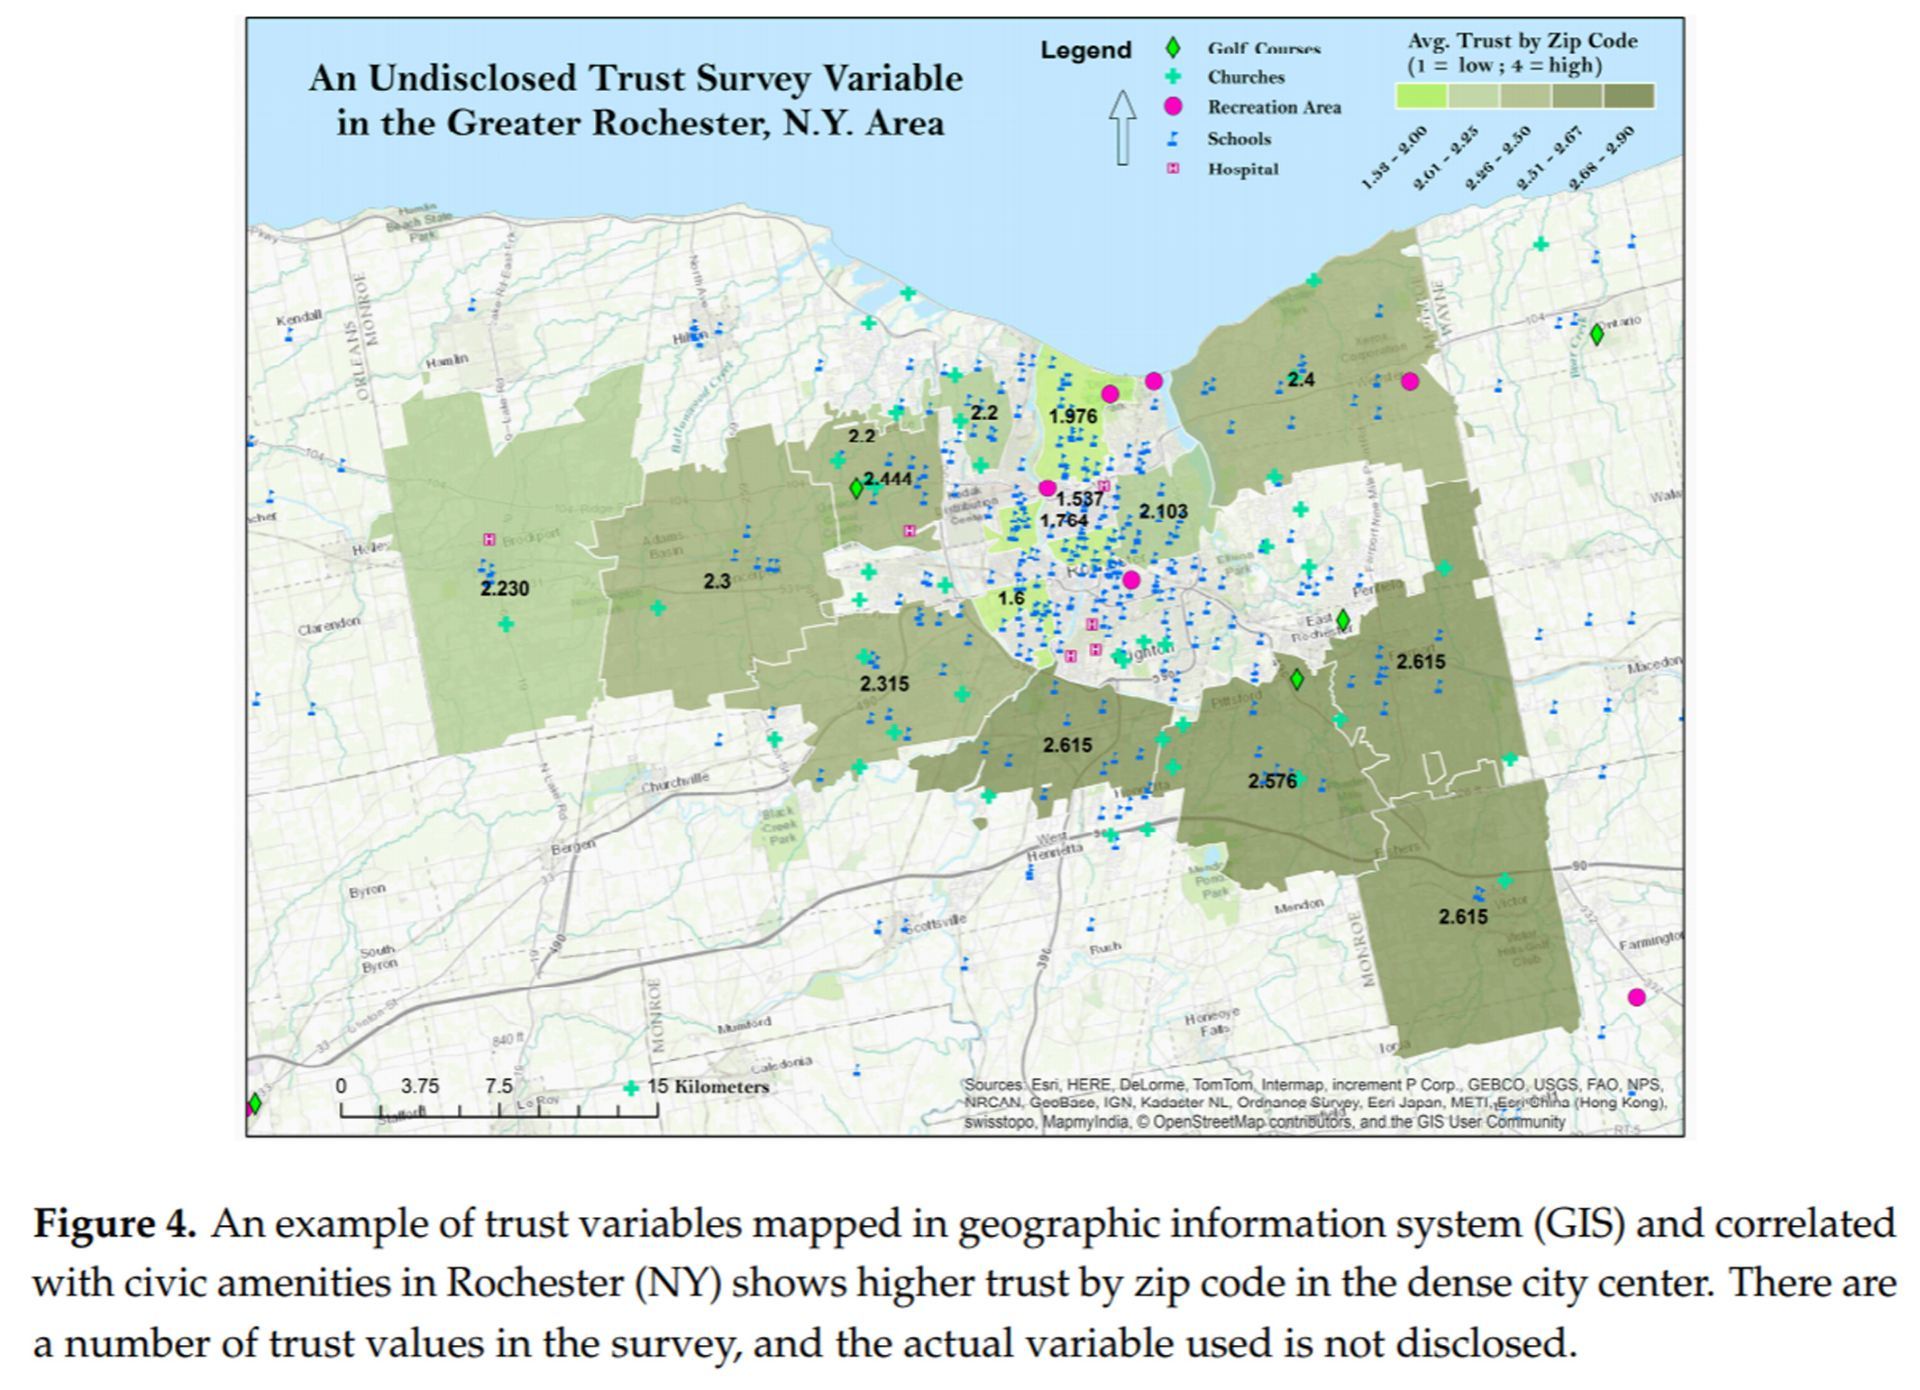
A Geographic Information System (GIS)-Based Analysis of Social Capital Data: Landscape Factors That Correlate with Trust

Findings: We trust our neighbors less when there are more people, lower housing value, weaker amenities (libraries and schools), and lower home ownership rates.

Method: Used Harvard University’s Saguaro Seminar’s 2006 Social Capital Community Benchmark Surveto create a national-level case study and a specific city case study for Rochester, NY.

Good For: If you are interested in learning how to increase trust in a community. Targeted marketing for websites like Neighborly which rely on strong communities.

Book Review: Modeling Cities and Regions as Complex Systems: From Theory to Planning Applications

FindingsModeling Cities and Regions as Complex Systems effectively challenges long-standing principles of urban planning, and uses mathematical models to quantify land use types and and neighborhood effects, particularly pertaining to CA. They could expand by incorporating GIS and giving more context to maps to make them more easily understood.

Method: Reading the work and critically examining strengths and areas of improvements.

Good For: If you are considering reading Modeling Cities and would like a review from an expert in the field.

Andris C (2017) Book Review: Modeling Cities and Regions as Complex Systems: From Theory to Planning Applications. Environment and Planning B. 44(2): 385-386.

Integrating Social Network Data into GISystems

Findings: Considering where people are when we examine social networks can help us decide anything from where to advertise to where to build a hospital.

Methods: Describe why modeling socialization in geographic space is essential for understanding human behavior. Outline best practices and techniques for embedding SN in GISystems. Explore case studies in Bolivia, China, Côte d’Ivoire, Singapore, the United Kingdom, and the United States.

Good For: If you want to understand time importance of adding GIS to social network analysis. Some examples: considering how diseases spread (useful for CEID), how likely a person is to have a place to go in the event of a natural disaster, or If you’re deciding where to open a brick and mortar business that appeals to certain social networks.