The Friendly Cities Lab was an initiative run from 2014-2026 at Georgia Tech (2019-2026) and Penn State (2014-2019). Our lab director, Clio Andris, is an associate professor in the the School of City & Regional Planning and School of Interactive Computing at Georgia Tech.
We have a few ongoing projects that will run through Summer of 2027.
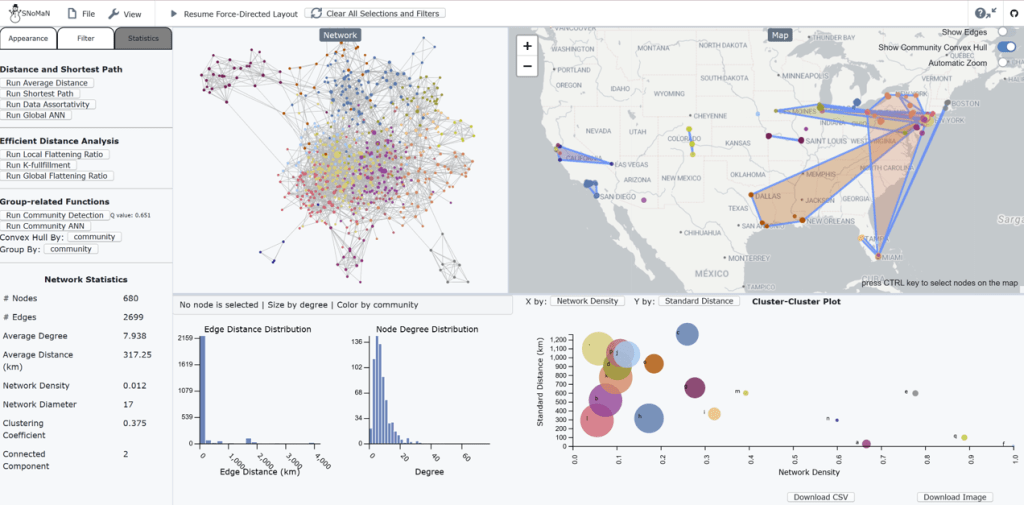
PROJECT 1: The SNOMAN project is coming to a close in 2026 after FIVE GREAT YEARS!! We have a few papers in review related to that project, including work by Sichen Jin and Max Hill, and we’ll be at SUNBELT 2026 to present our work.
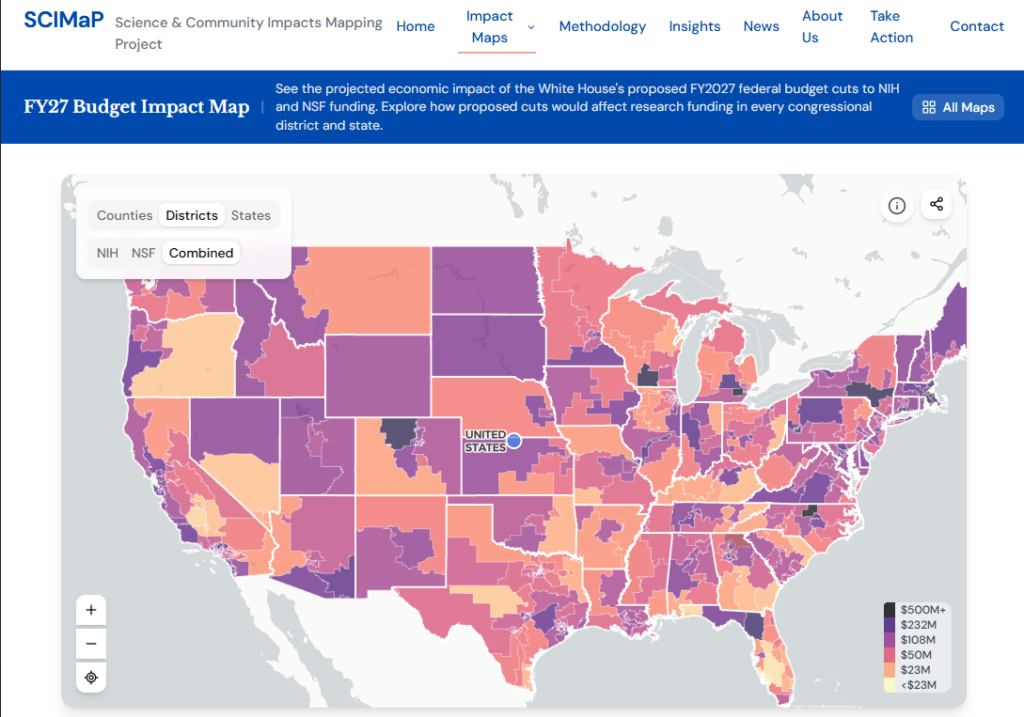
PROJECT 2: The SCIMaP Team continues to put together information about cancelled health grants and losses in indirect costs. Check out the project here.
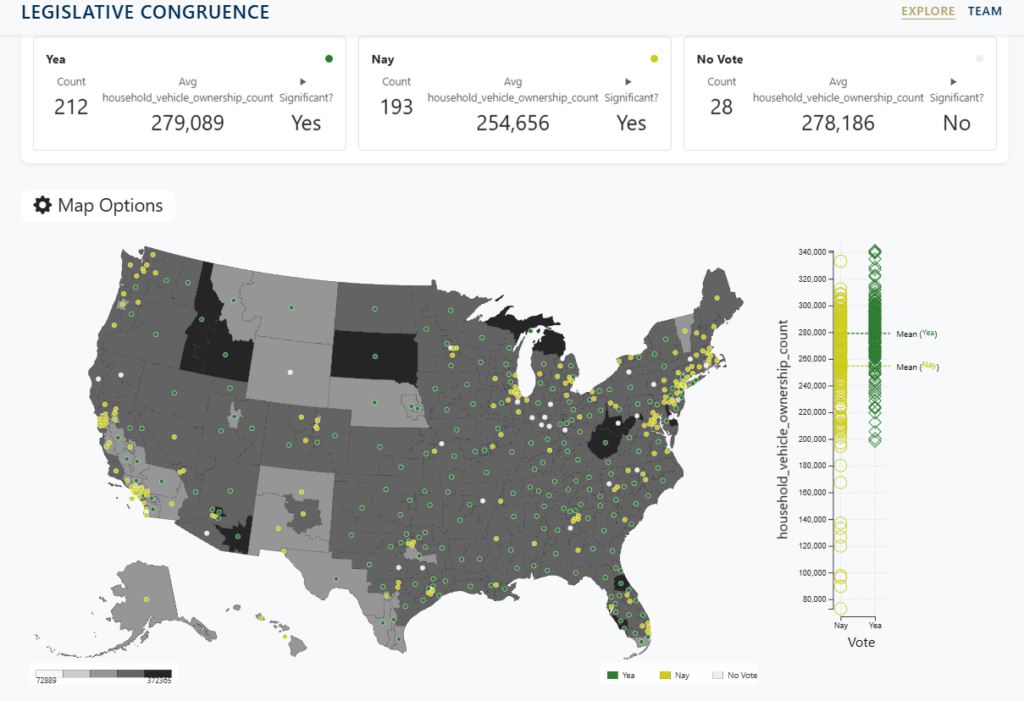
PROJECT 3: Our Legislative Congruence map was launched in 2026. Here’s our prototype and a link to our technical report is coming (or email clio). This map allows us to compare the outcome of bill votes in Congress to different characteristics of congressional units. This project is being applied to a to a local Georgia case using energy data through summer of 2027 sponsored by GT’s Energy Policy and Innovation Center (EPIcenter) program.
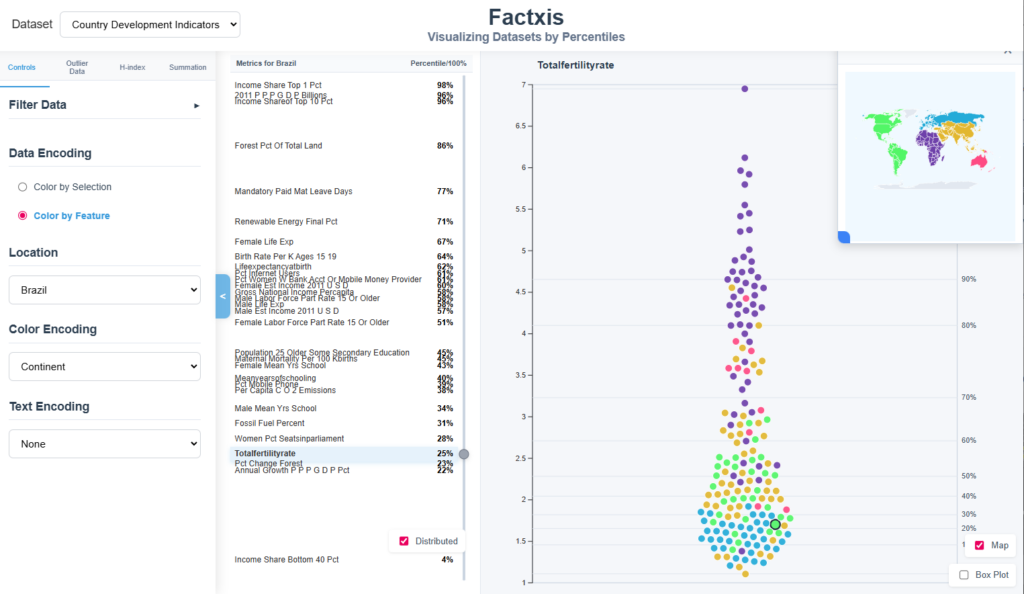
PROJECT 4: Factxis is our new tool for helping spreadsheet users and demographic data users explore different places (or entities) that have a lot of different features (variables). We’re testing it and developing in summer 2026.
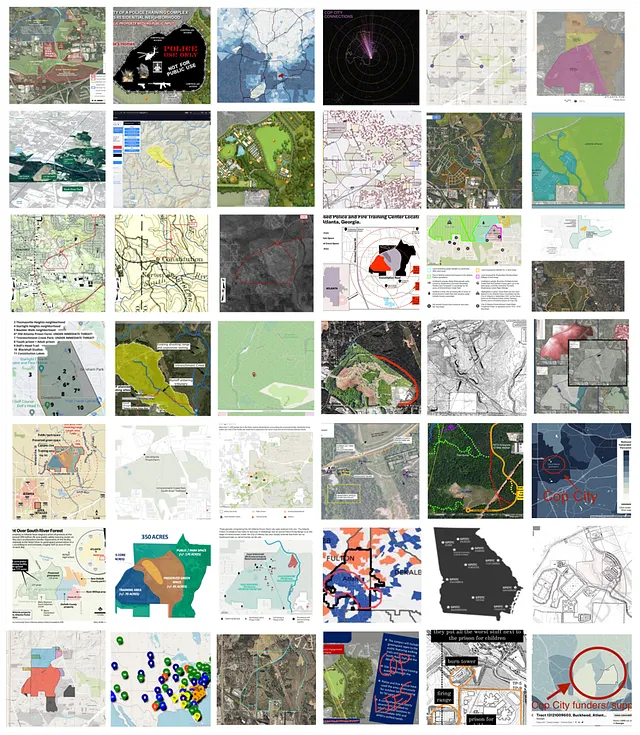
PROJECT 5: Carceral studies are a critical part of urban planning. In an ongoing study in 2026, we are documenting the environmental sensing and technology needs of incarcerated persons, with Alex Cabral and Josiah Hester. See a related piece here on a justice related movement, that was presented in 2026 at Atlanta Studies, and in 2025 at CSCW.
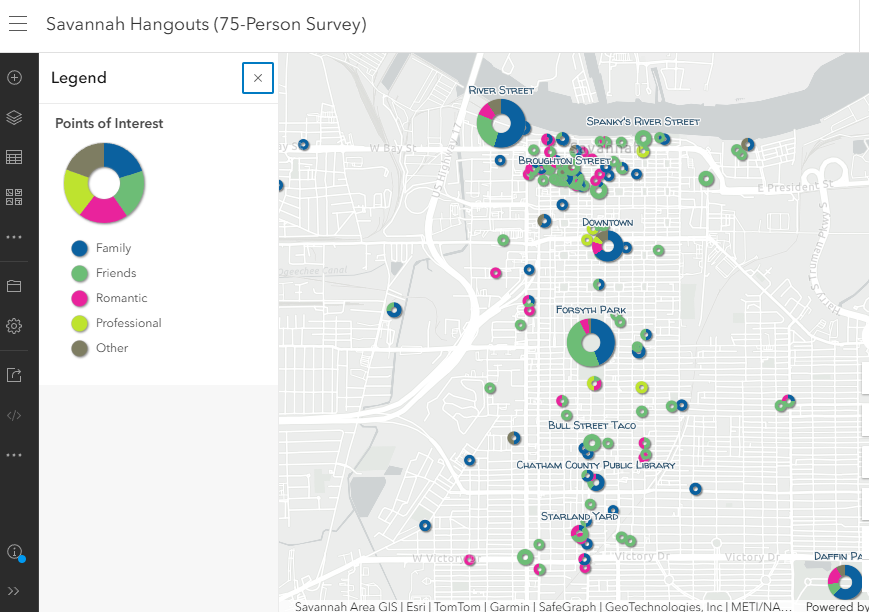
PROJECT 6: Check out the Savannah Social project, where we worked with the City of Savannah and Prof. Meimei Lin. We continue to work with data from this project and are examining how Savannah’s social infrastructure helps the city.
Et Cetera: There are more…PhD student Gabriel Appiah is studying differences in GIS technologies and education in the global north and south. We have a number of masters’ students working on local capstone projects and we have a few ongoing partnership projects. Clio is also working on a qualitative project about placemaking and entrepreneurship in very small towns.