Challenges for Social Flows

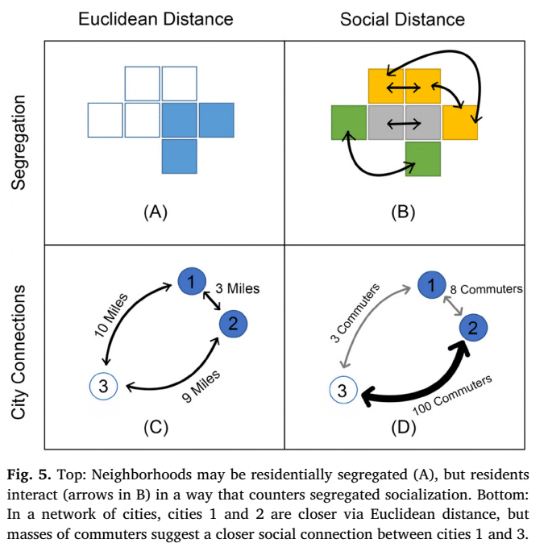
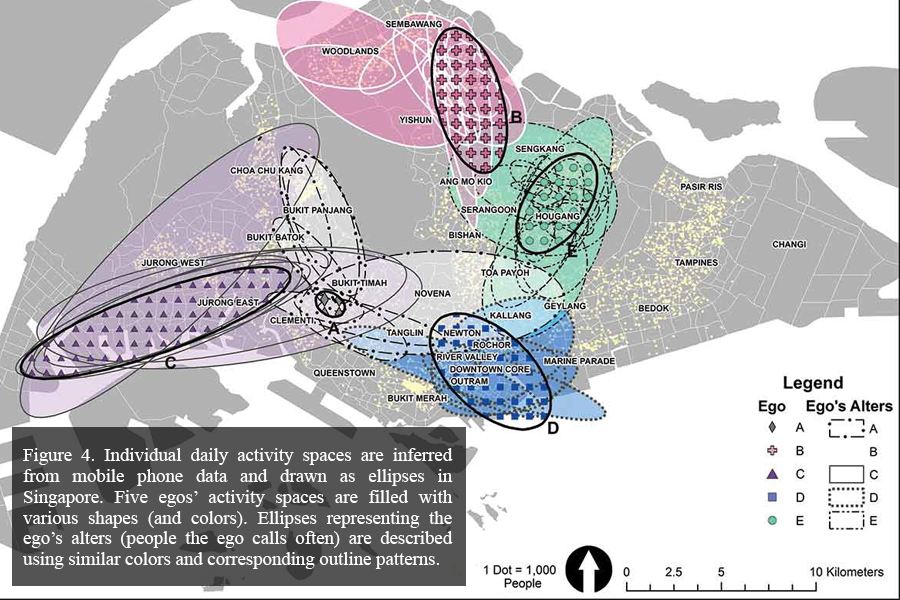
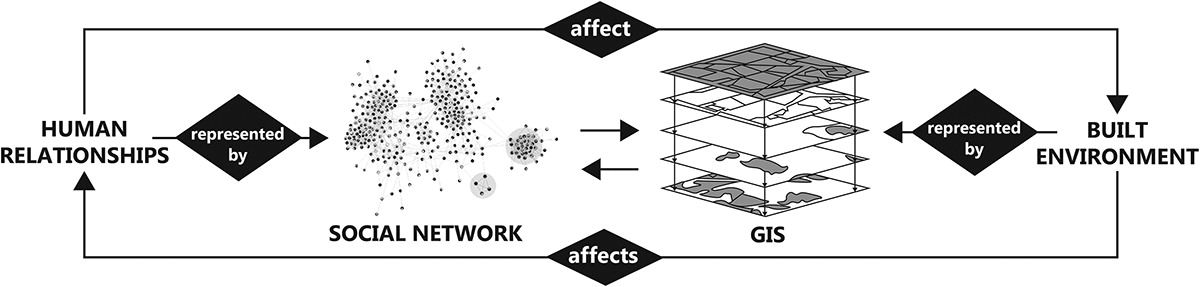
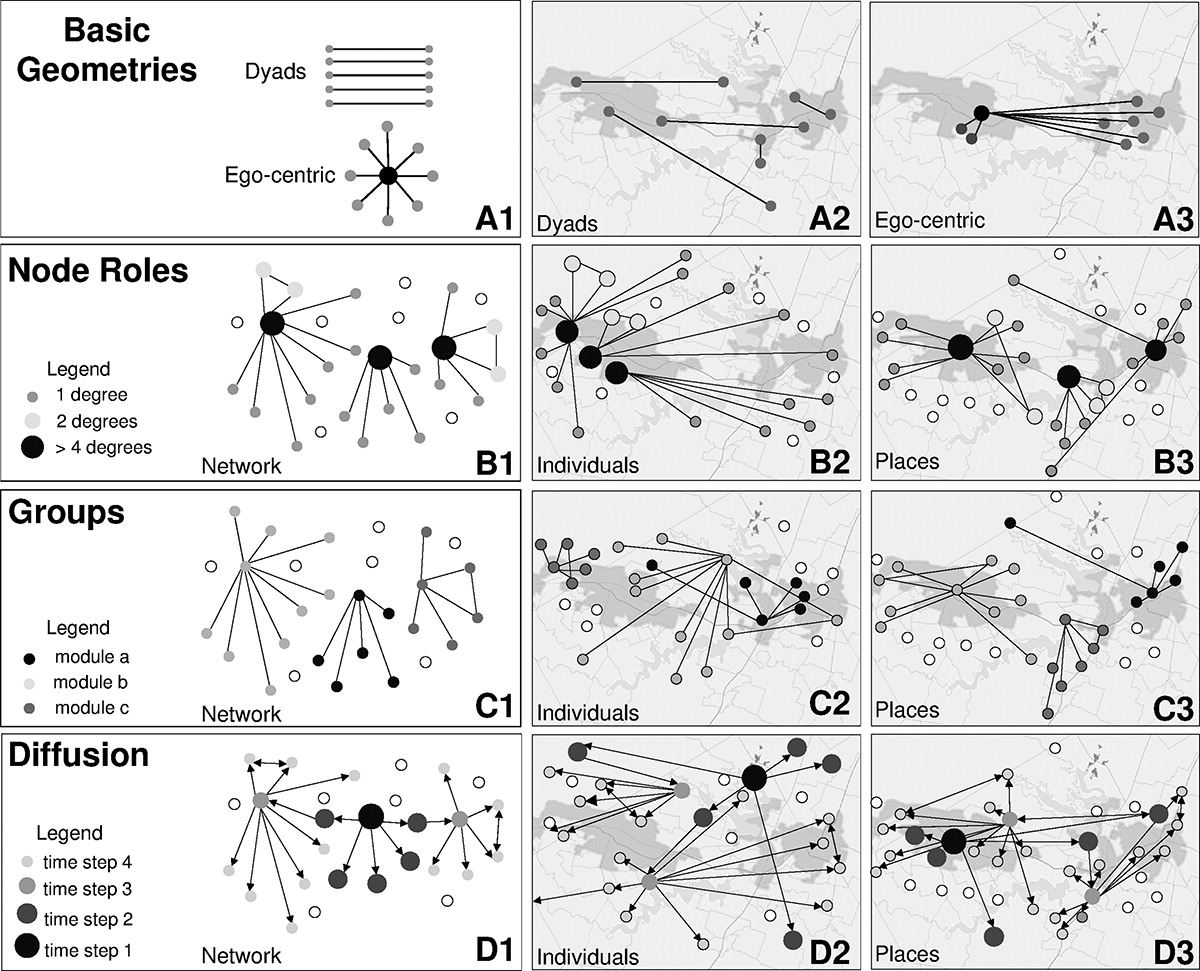
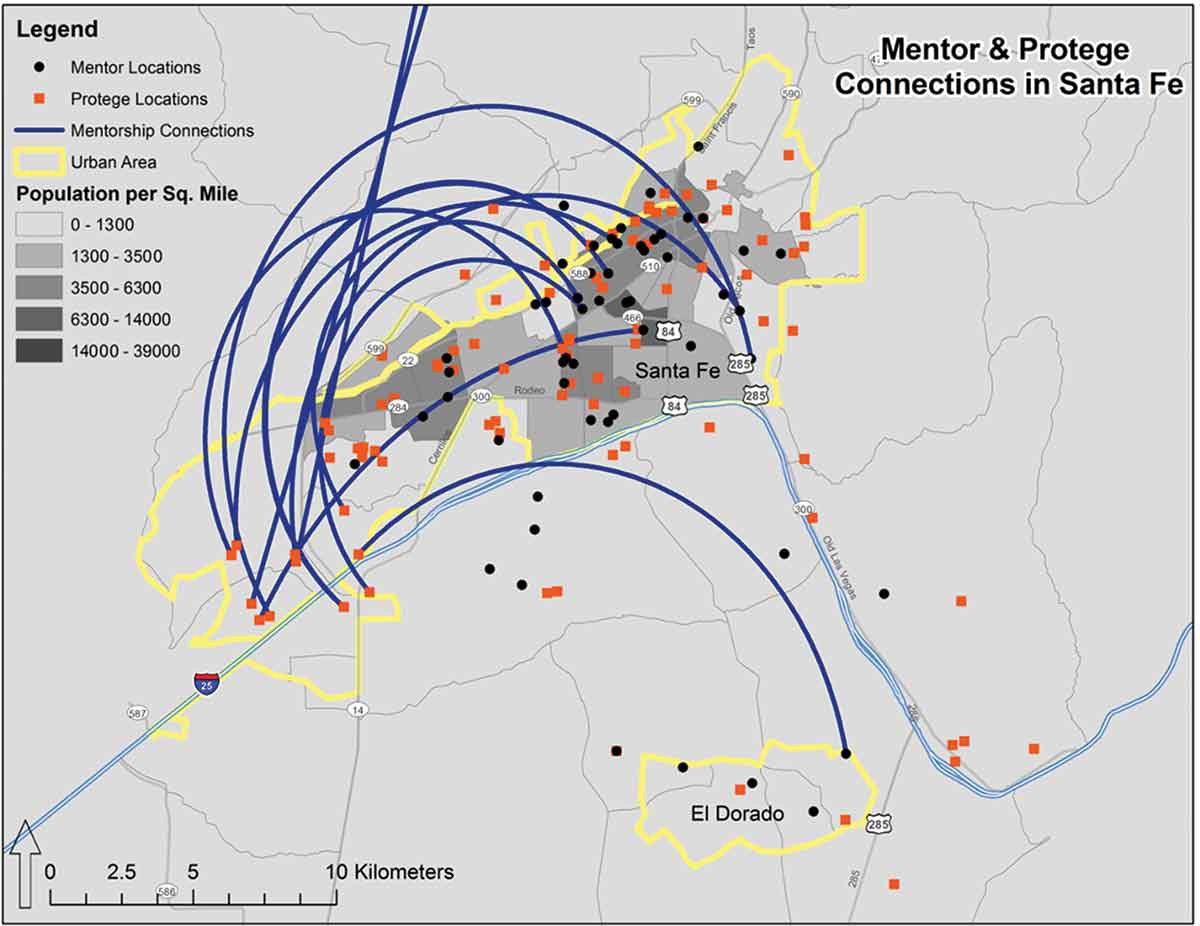
The social flow is a linear geographic feature that evidences an individual’s decision to connect places through travel, telecommunications and/or declaring personal relationships. These flows differ from traditional spatial networks (roads, etc.) because they are often non-planar, and provide evidence of personal intentionality to interact with the built environment and/or to perpetuate relationships with others.

We use tons of social flow data in today’s research, and so, we create new typologies, address new problems, and redefine social distance as the manifestation of social flows. We describe challenges for leveraging these data with commercial GISystems in terms of representing, visualizing, manipulating, statistically analyzing and ascribing meaning to social flows.

Measuring Geographic Pull Power: A Case Study of College Athletics

Student athletes increase the diversity of schools. Which universities draw students from distant and diverse locales? We put together “pull power statistics” for 160,000 student-athletes from more than 1,600 university team rosters at 128 schools over various years. Stats include mean distance traveled, count of unique hometowns, percentage of international student-athletes, and a new distance decay “apex” method to rank schools by their pull power. Western U.S. (like U. Idaho and U. Arizona) and private schools (like Harvard) lead the ranks. Schools like Rutgers, Catholic University, UMBC and U. Illinois-Chicago have a lot of local student athletes.

Using Yelp to Find Romance in the City: A Case of Restaurants in Four Cities

Findings: There’s a certifiable difference in urban hot spots and demand depending on couples’ relationship stage. Key factors for selecting a romantic date spot include ambiance (cozy & classy atmosphere), high prices, and downtown locations. Couples with families (children) tend to prefer less expensive restaurants, with great service and (probably) accessible parking. Special occasion locations are concentrated in downtown areas, especially for Las Vegas and Pittsburgh, but are more distributed for sprawling cities like Phoenix and Charlotte.

Method: Natural Language Processing of Yelp reviews to scan for correlations of certain keywords, cross-referenced with locations of restaurants.

Good For: If you are opening a bar or restaurant and would like to influence the potential clientele, or if you would like to glean insight into the romantic life cycle.

Wealthy Hubs and Poor Chains: Constellations in the U.S. Urban Migration System

Findings: Geographically isolated, large cities (like Dallas and Phoenix) tend to receive the most migrants from other US cities. Destination cities turn over regularly over time. The overall diversity of destinations (bag-of-cities) for migrants is decreasing despite the rise of mobile technologies, i.e. migrants now have ‘hot spots’ that they go to, instead of a distributed set of options like in the early 1990s. We find this counter-intuitive, as the Internet makes it easier to search for new jobs and housing in distant places. Poorer migrants tend to follow chains of nearby cities, while richer migrants create a hub and spoke network, where the hubs are often retirement areas in Florida like Cape Coral.

Method: Mapping US migration flows in constellations, assigning nodes and edges to cities, and charting changes based on 20 years of IRS data at the MSA Level.

Good For: If you would like to learn more about where a population of a given city lived previously, or if you are interested in predicting where people will go. Any business marketing to transplant demographics. Guide to using graph theory motifs for urban networks.

Measuring Attraction and Redistribution of Institution-Based Movements

Findings: Penn State draws more students that are closer to the university and come from higher income families. Alumni from large PA cities facing economic downturns return to those cities more often than those from Philadelphia or New Jersey.

Method: Applying clustering and socio-economic modelling statistical methods to measure changes in the Pennsylvania State University’s population draw and redistribution power from 1995-2015, focusing on the U.S. Mid-Atlantic Region.

Good For: If you want to know the geographic composition of Penn State students, which can be useful for marketing to under-represented areas or planning alumni events.

A Geographic Information System (GIS)-Based Analysis of Social Capital Data: Landscape Factors That Correlate with Trust

Findings: We trust our neighbors less when there are more people, lower housing value, weaker amenities (libraries and schools), and lower home ownership rates.

Method: Used Harvard University’s Saguaro Seminar’s 2006 Social Capital Community Benchmark Surveto create a national-level case study and a specific city case study for Rochester, NY.

Good For: If you are interested in learning how to increase trust in a community. Targeted marketing for websites like Neighborly which rely on strong communities.

Book Review: Modeling Cities and Regions as Complex Systems: From Theory to Planning Applications

FindingsModeling Cities and Regions as Complex Systems effectively challenges long-standing principles of urban planning, and uses mathematical models to quantify land use types and and neighborhood effects, particularly pertaining to CA. They could expand by incorporating GIS and giving more context to maps to make them more easily understood.

Method: Reading the work and critically examining strengths and areas of improvements.

Good For: If you are considering reading Modeling Cities and would like a review from an expert in the field.

Andris C (2017) Book Review: Modeling Cities and Regions as Complex Systems: From Theory to Planning Applications. Environment and Planning B. 44(2): 385-386.

Integrating Social Network Data into GISystems

Findings: Considering where people are when we examine social networks can help us decide anything from where to advertise to where to build a hospital.

Methods: Describe why modeling socialization in geographic space is essential for understanding human behavior. Outline best practices and techniques for embedding SN in GISystems. Explore case studies in Bolivia, China, Côte d’Ivoire, Singapore, the United Kingdom, and the United States.

Good For: If you want to understand time importance of adding GIS to social network analysis. Some examples: considering how diseases spread (useful for CEID), how likely a person is to have a place to go in the event of a natural disaster, or If you’re deciding where to open a brick and mortar business that appeals to certain social networks.

A Computational Model for Dyadic Relationships

Findings: Pairs of people in all kinds of relationships tend to collocate, telecommunicate, and feel inclinations towards one and other. People will telecommunicate with and feel inclinations towards their mothers more than their significant others, and find themselves collocated with friends more often than with roommates.

Method: Collecting diaries from 54 dyads (pairs of people) containing times and frequencies of interaction.

Good For: If you are seeking to understand human relationships through a quantified set of interactions. Marketers like 1800Flowers catering to pair sets could adjust advertisements based on how we prioritize our relationships.

Assessing an Educational Mentorship Program in an Urban Context

Findings: Participants in mentoring programs report increases in social capital with people with socio-economic differences, but most mentors and proteges are from similar socio-economic neighborhoods.

Methods: Surveying participants in mentoring programs in Santa Fe, New Mexico and cross-referencing US Census data on local demographics.

Good For: If you are considering participating in or starting a mentoring program and want to learn about perceived societal benefits.