To Racketeer among Friends: Spatial Features of Criminal Collaboration in the American Mafia

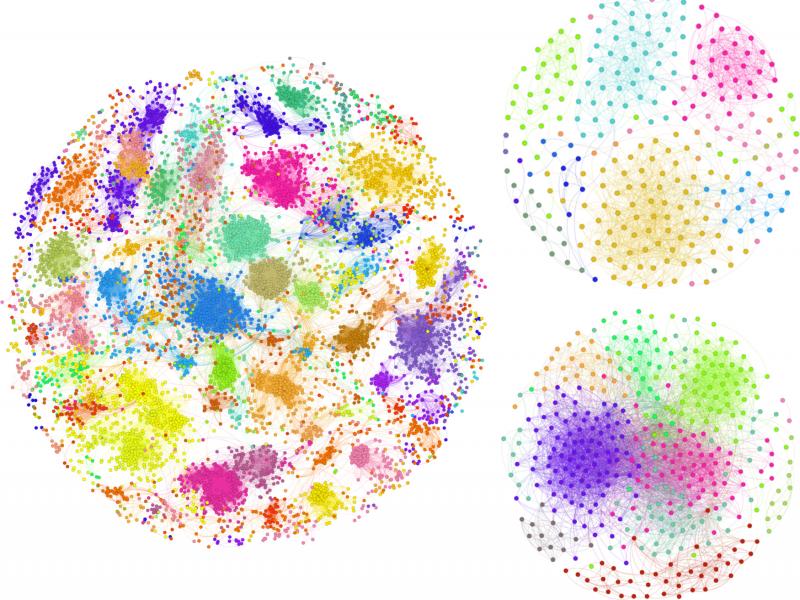
The American Mafia is known as a violent network of criminals engaged in drug trafficking, violence, and illegal activities. We analyzed a spatial social network (SSN) of 680 Mafia members where connections represent `known associates’ found through a 1960s federal crime investigation by the U.S. Federal Bureau of Narcotics. Members are geolocated to a known home address, and span across 15 major U.S. cities, concentrated in New York City. We ask four different research questions related to family, power, and coordination strategies.

Q1: Do families tend to live in clusters or distributed locations?
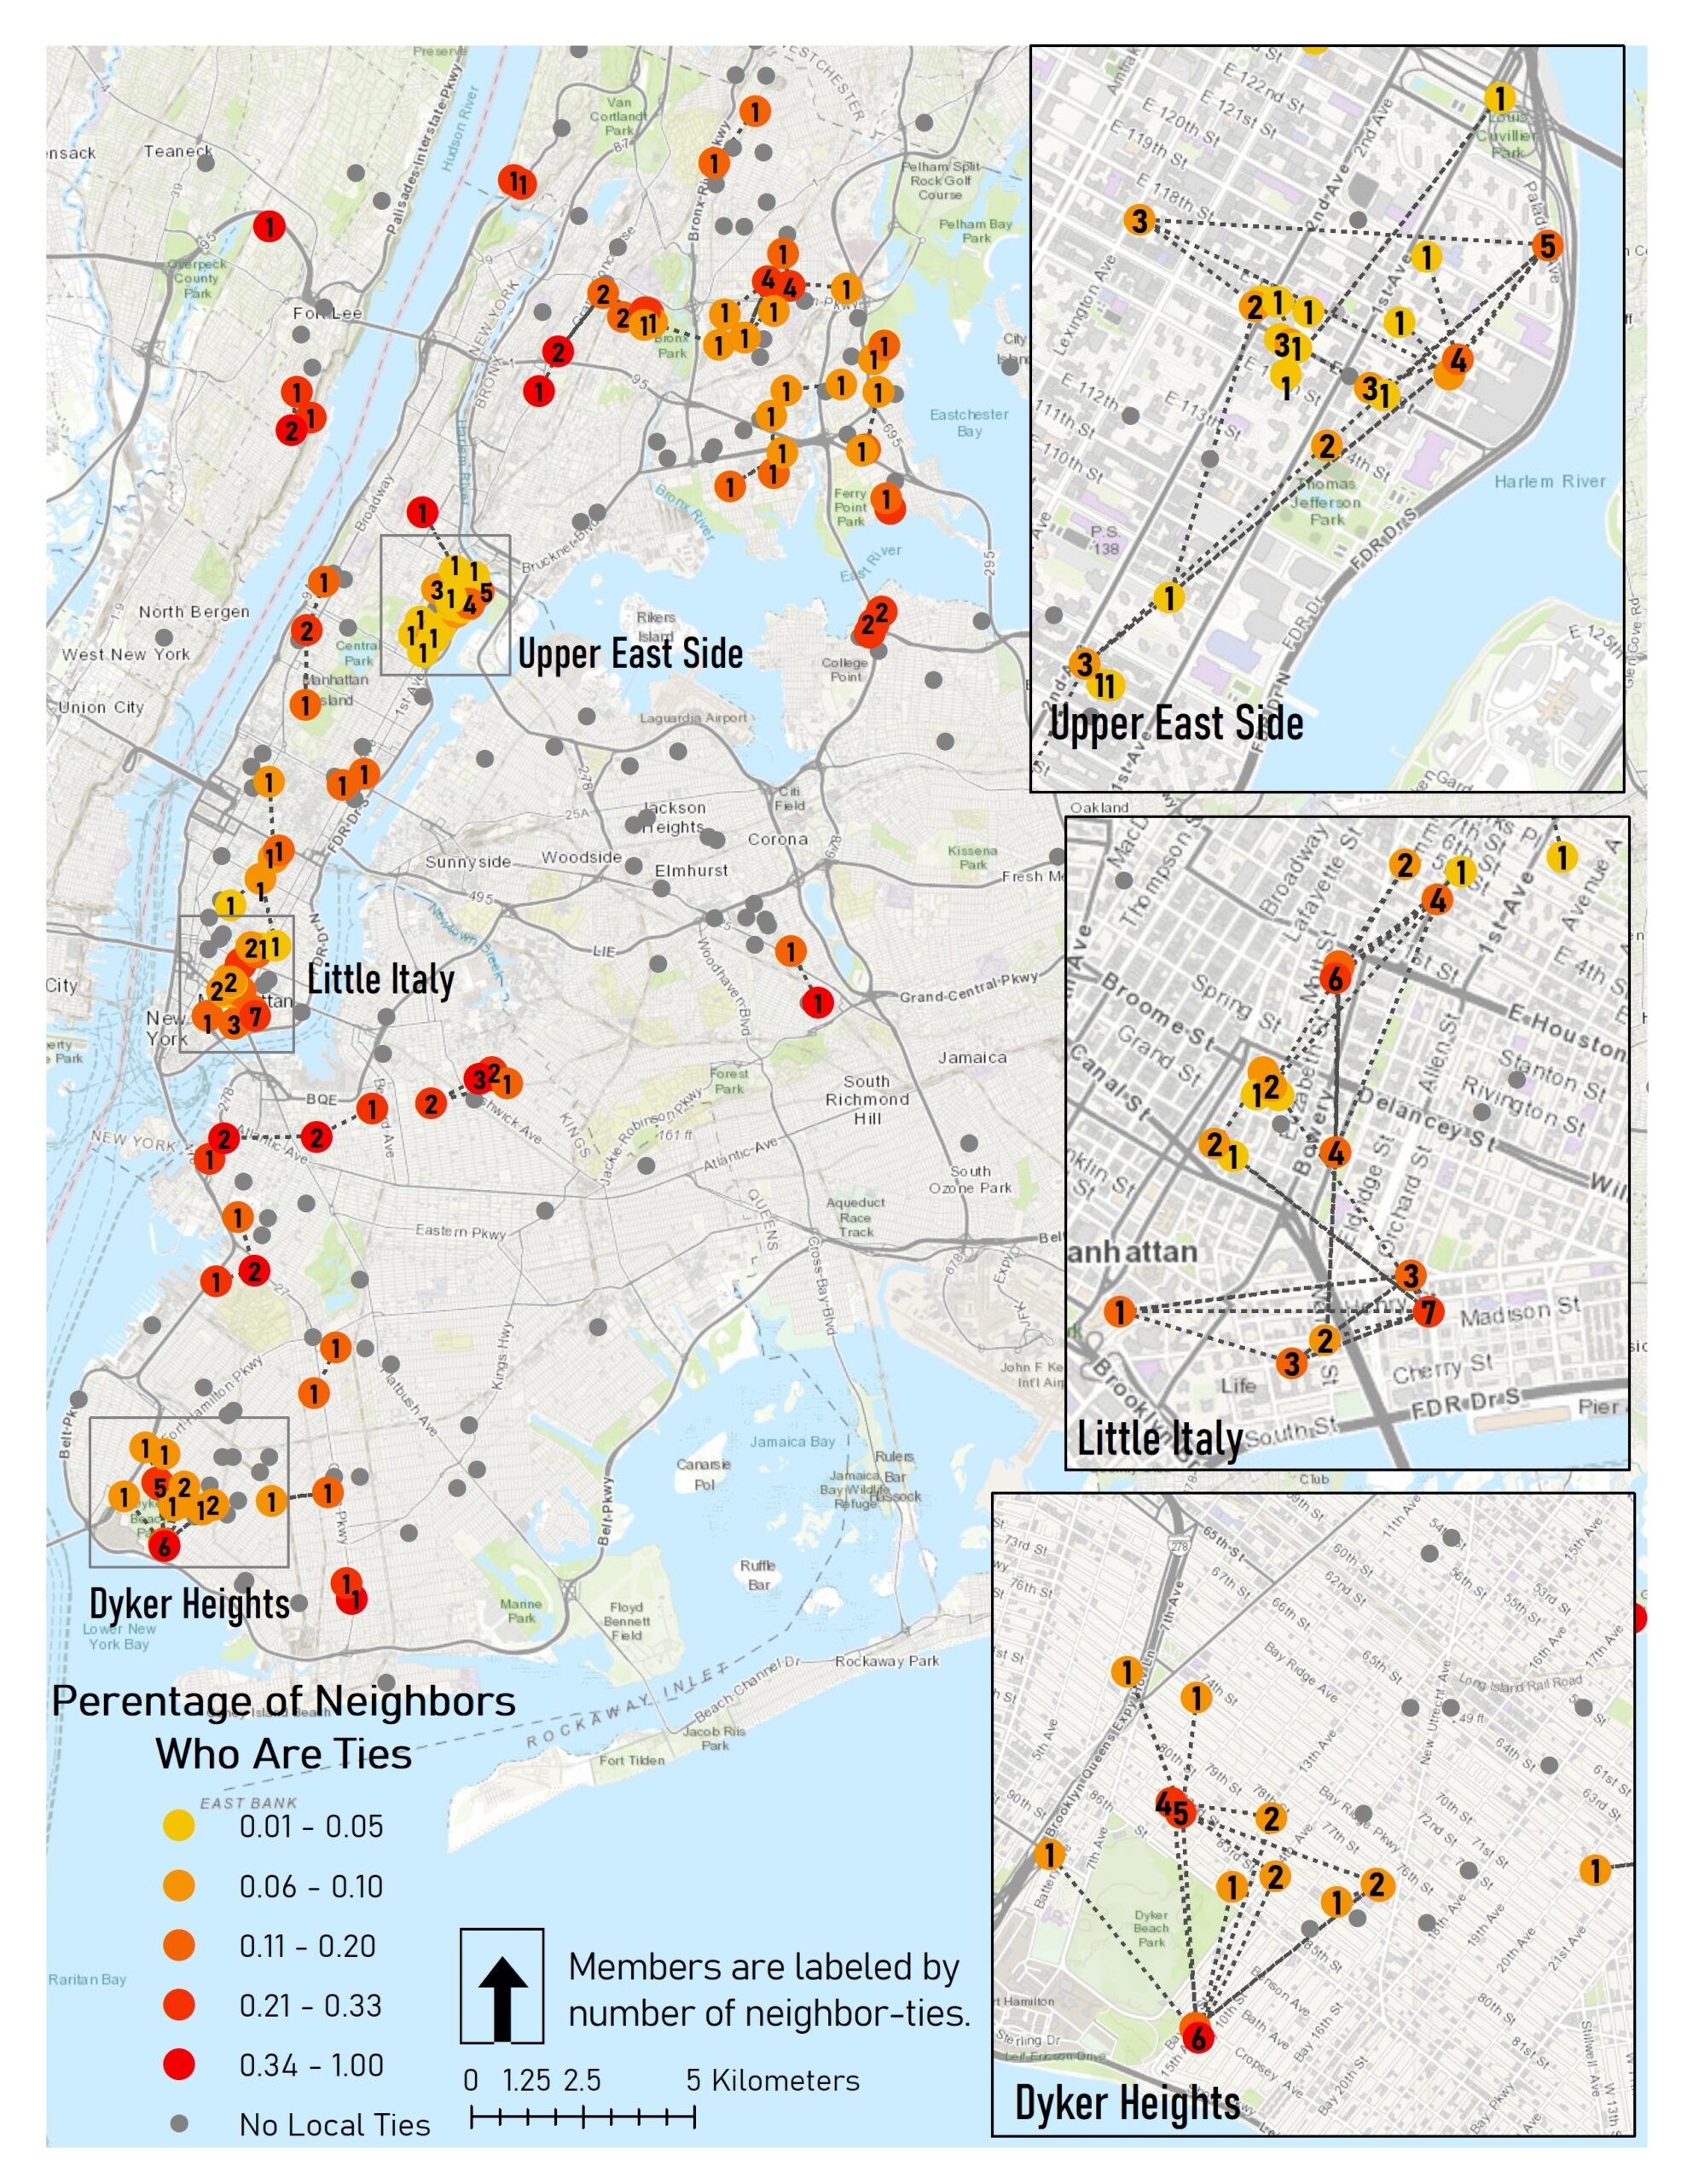
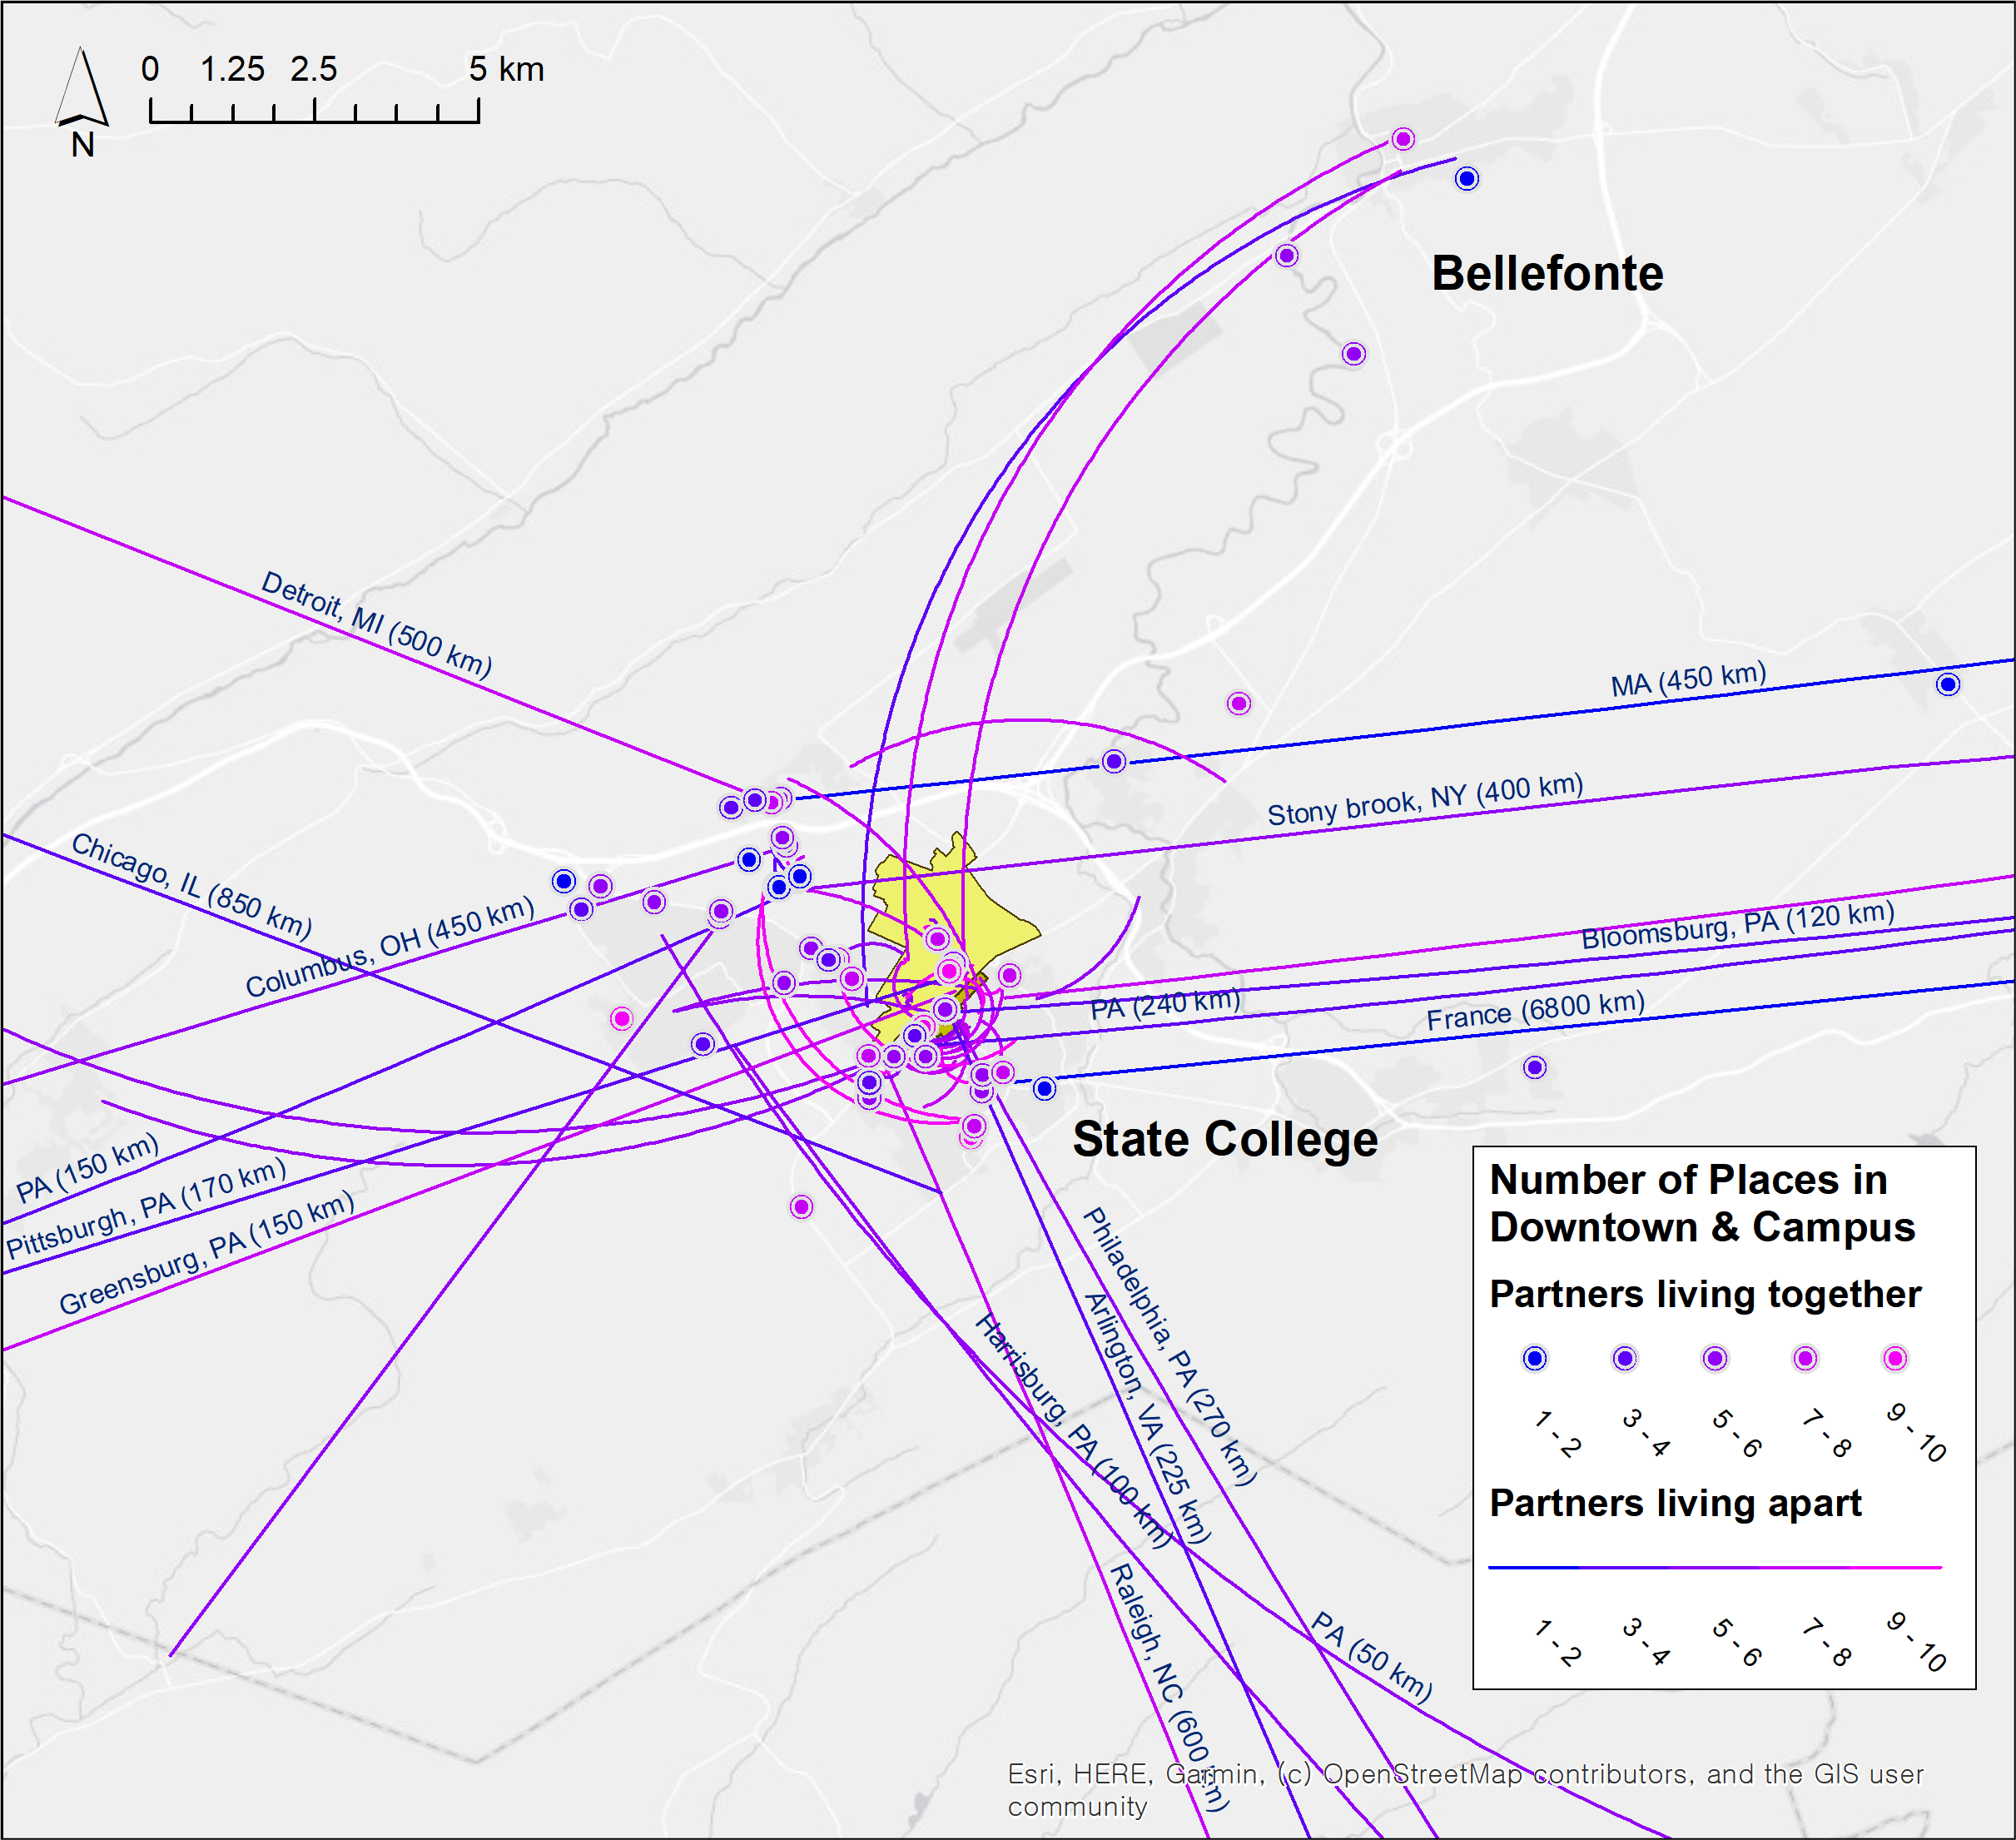
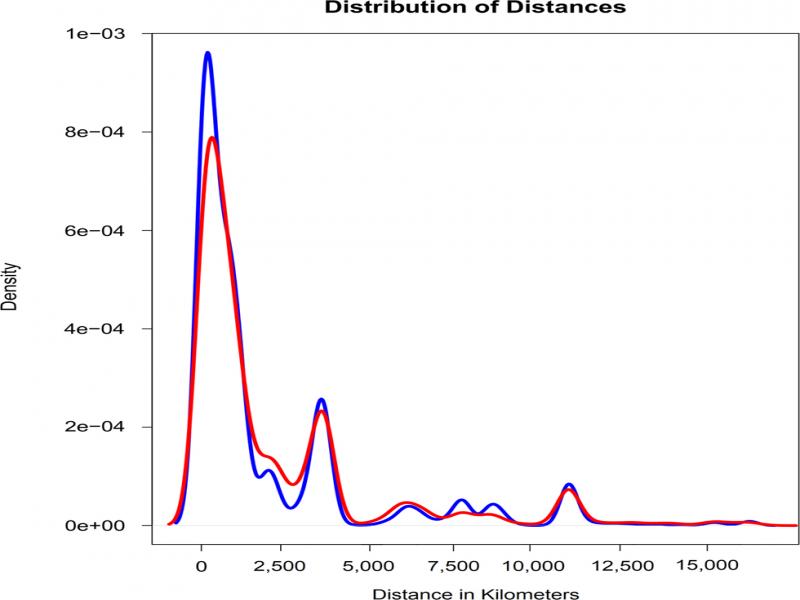
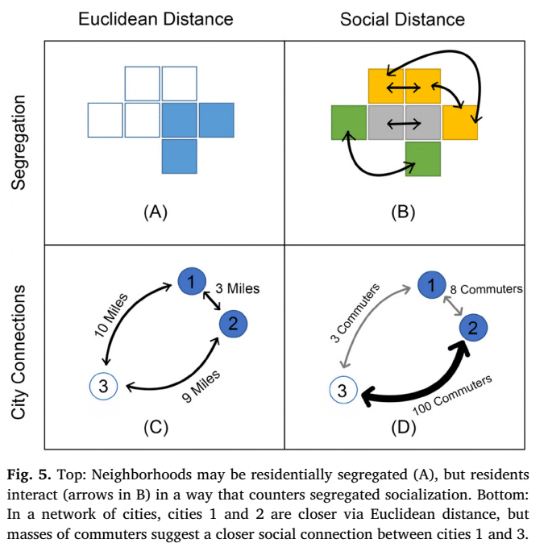
Q2: Do criminal associates tend to live near one another and are nearby members likelier to be associates?
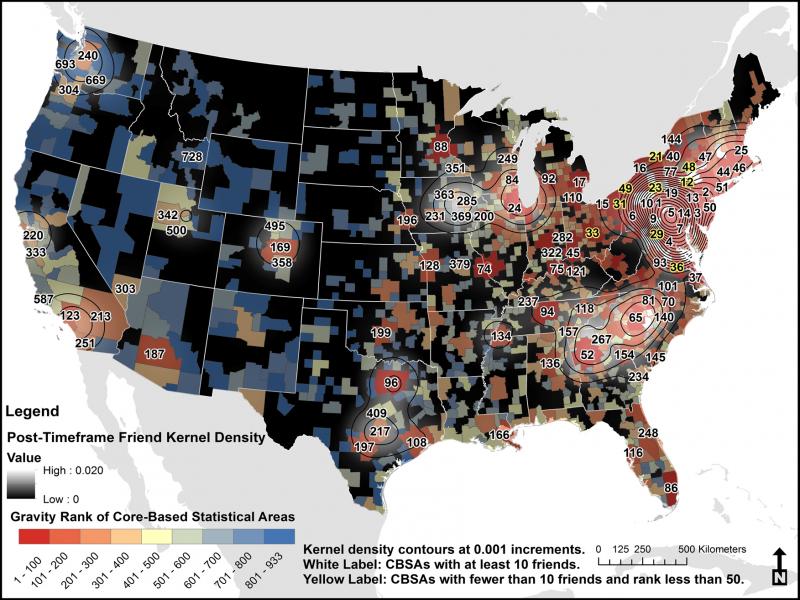
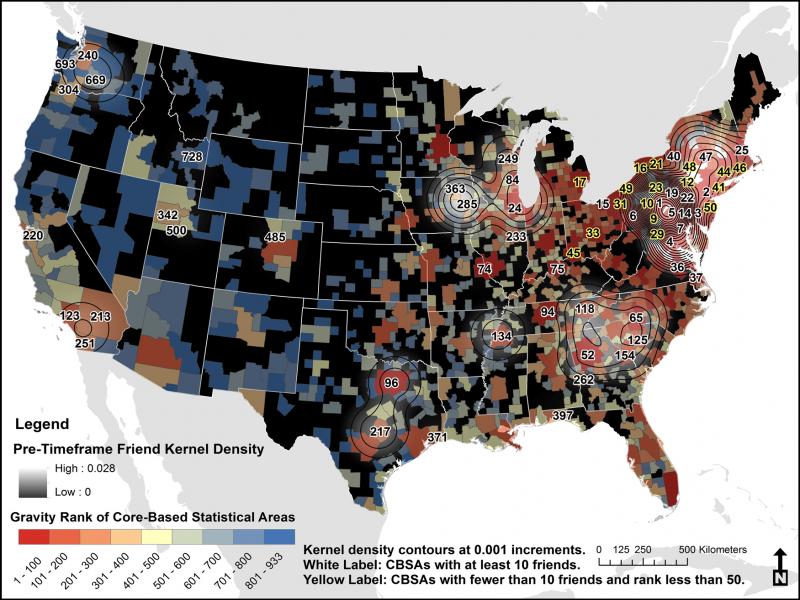
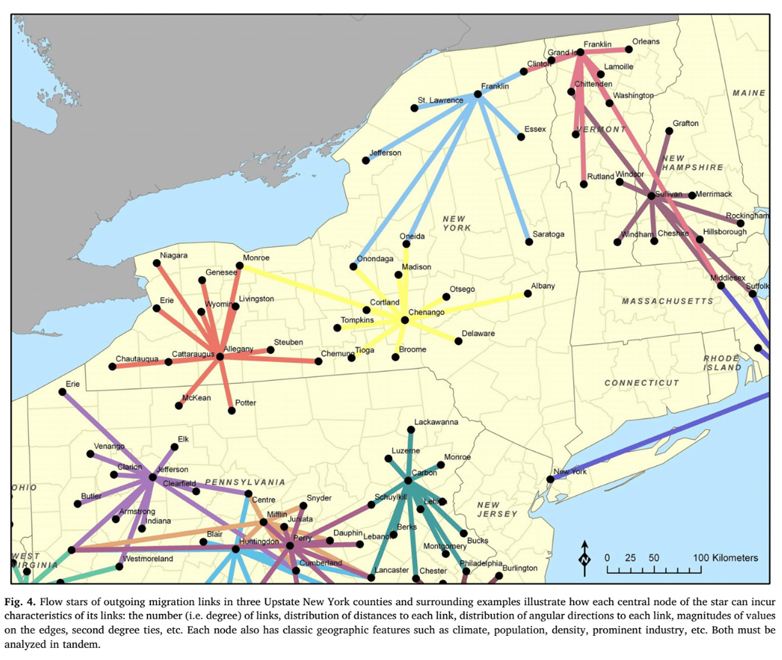
Q3: Are high-degree members found near their family centers, high-income areas, or near strategic physical features?
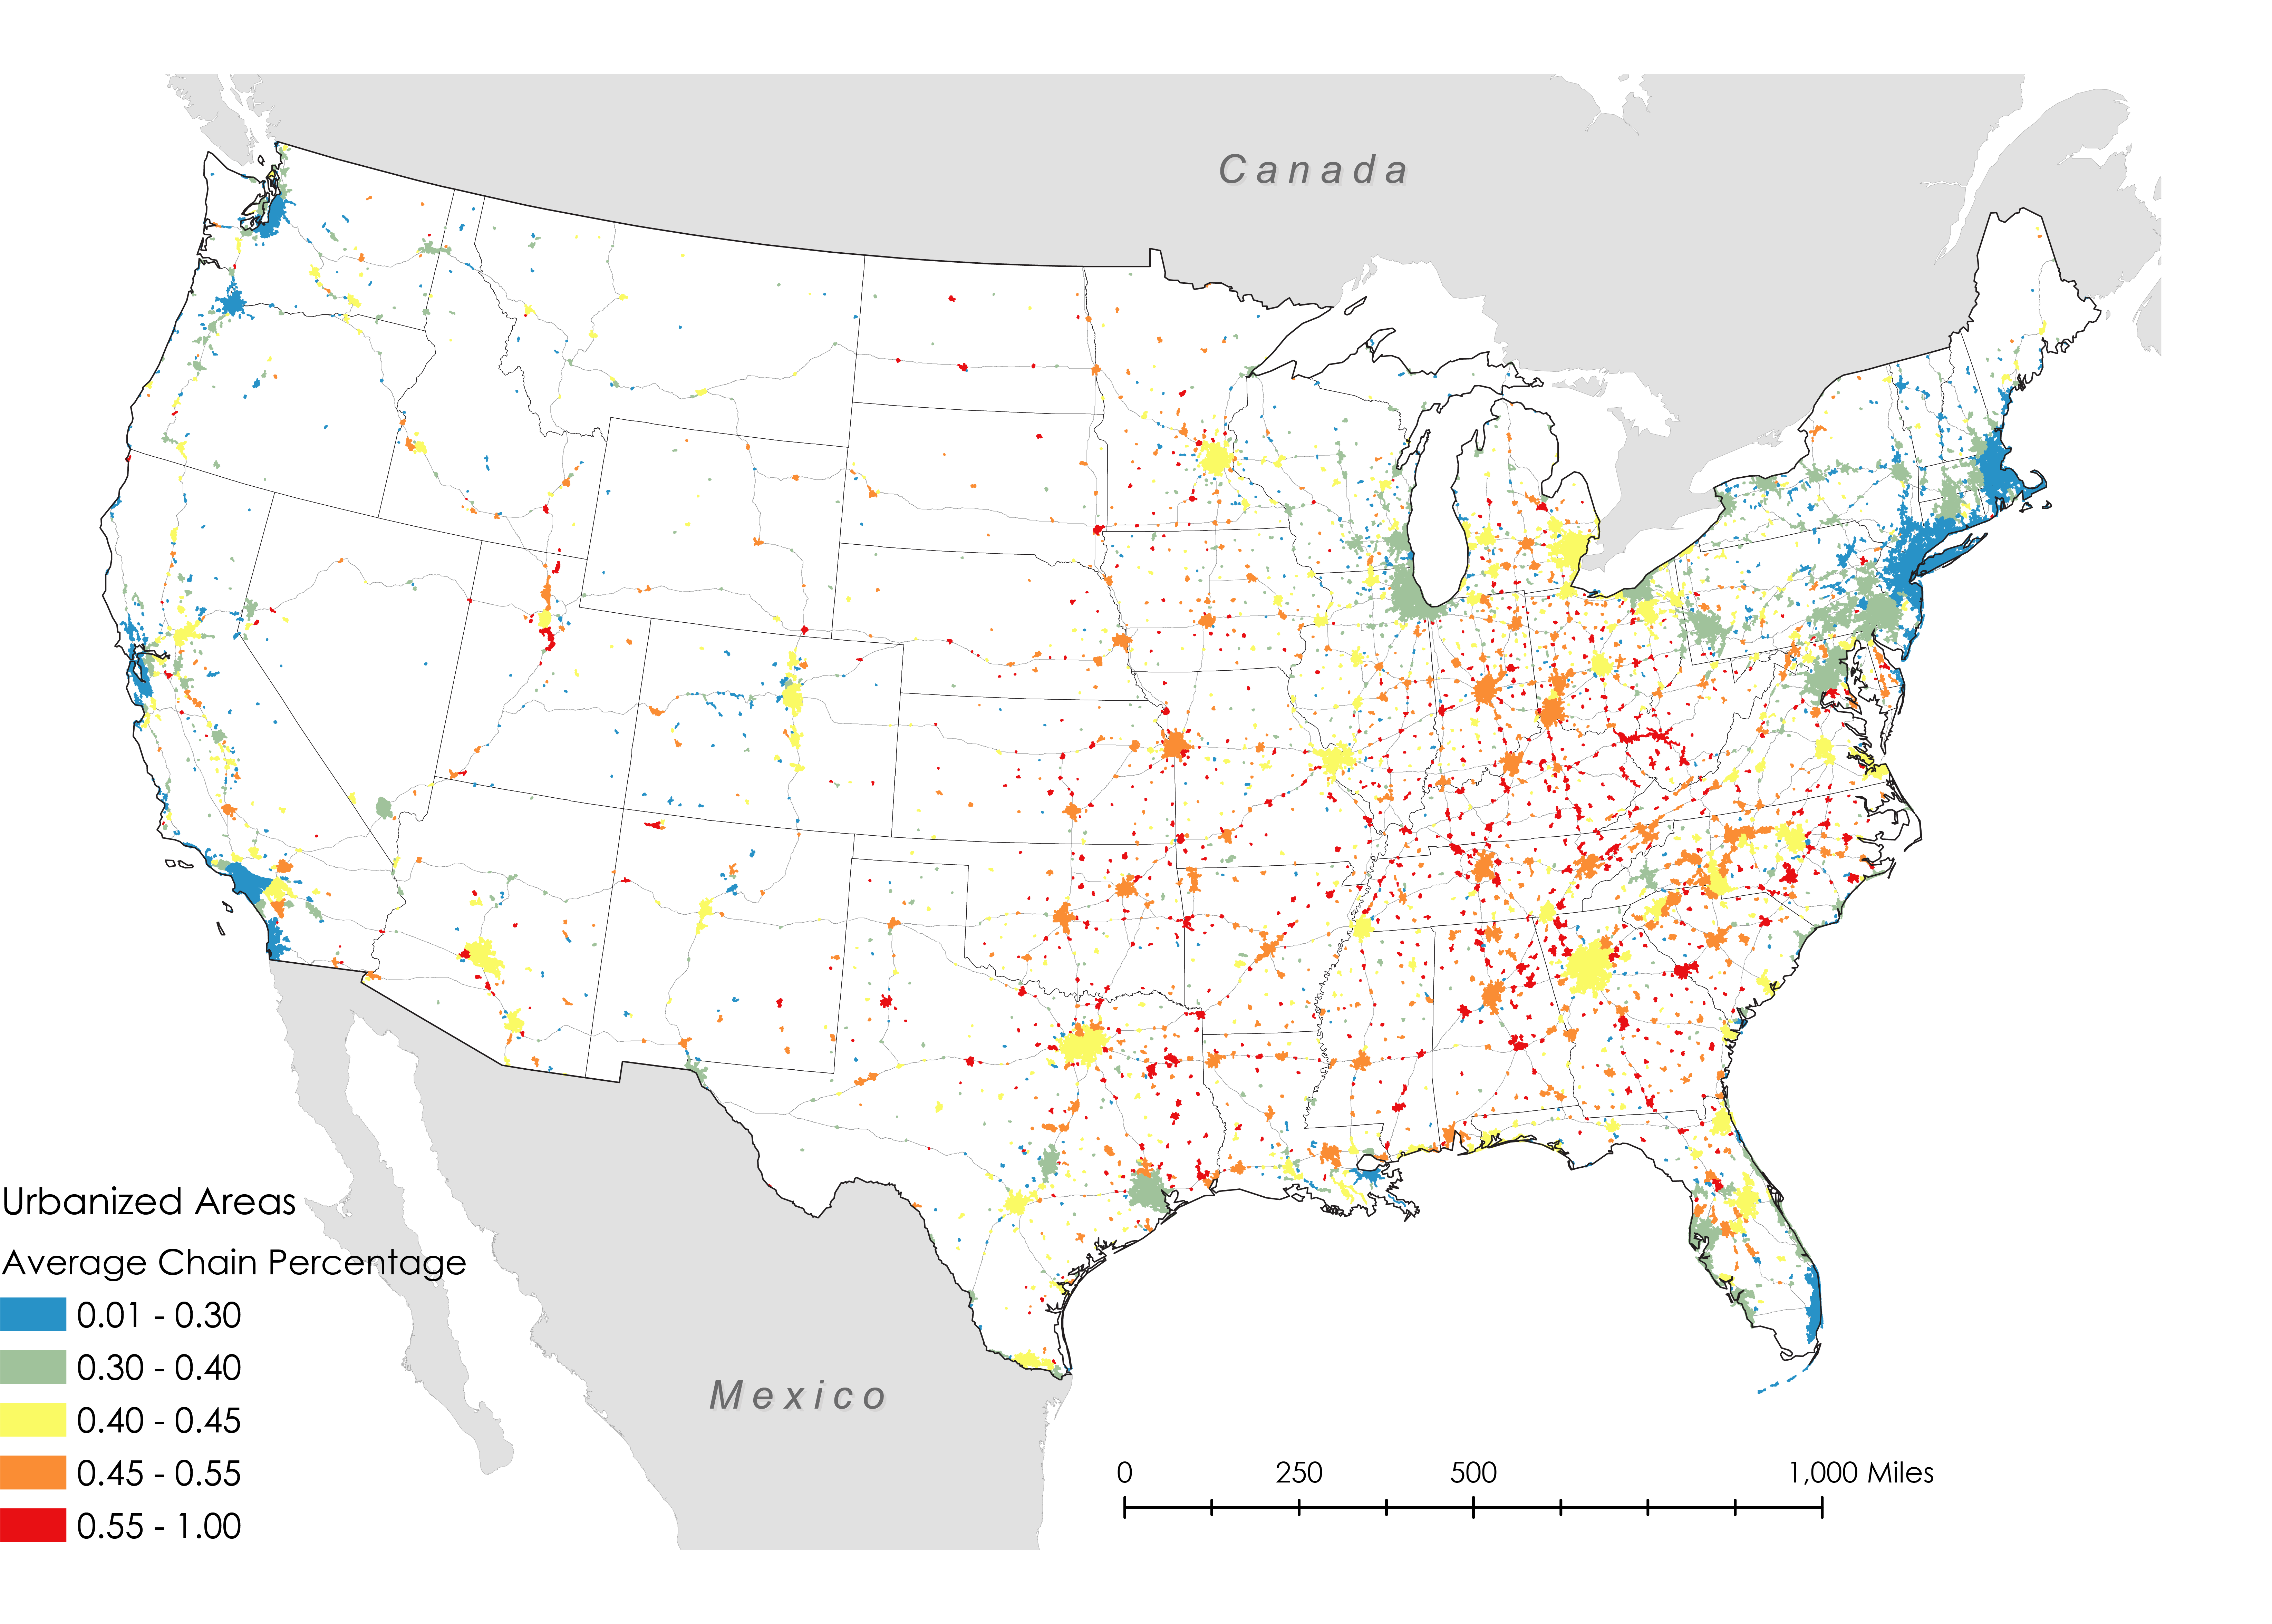
Q4: Does the network exhibit efficiency in geographic space?

The methods we used include:

Method (Research Question) Question
Cluster/Cluster Matrix (1) (new!) Do tight-knit networks cluster?
Network Density Hotspot (2) (new!) Are spatial neighbors connected?
Node Role GIS Analysis (3) Are high-degree nodes in special locations?
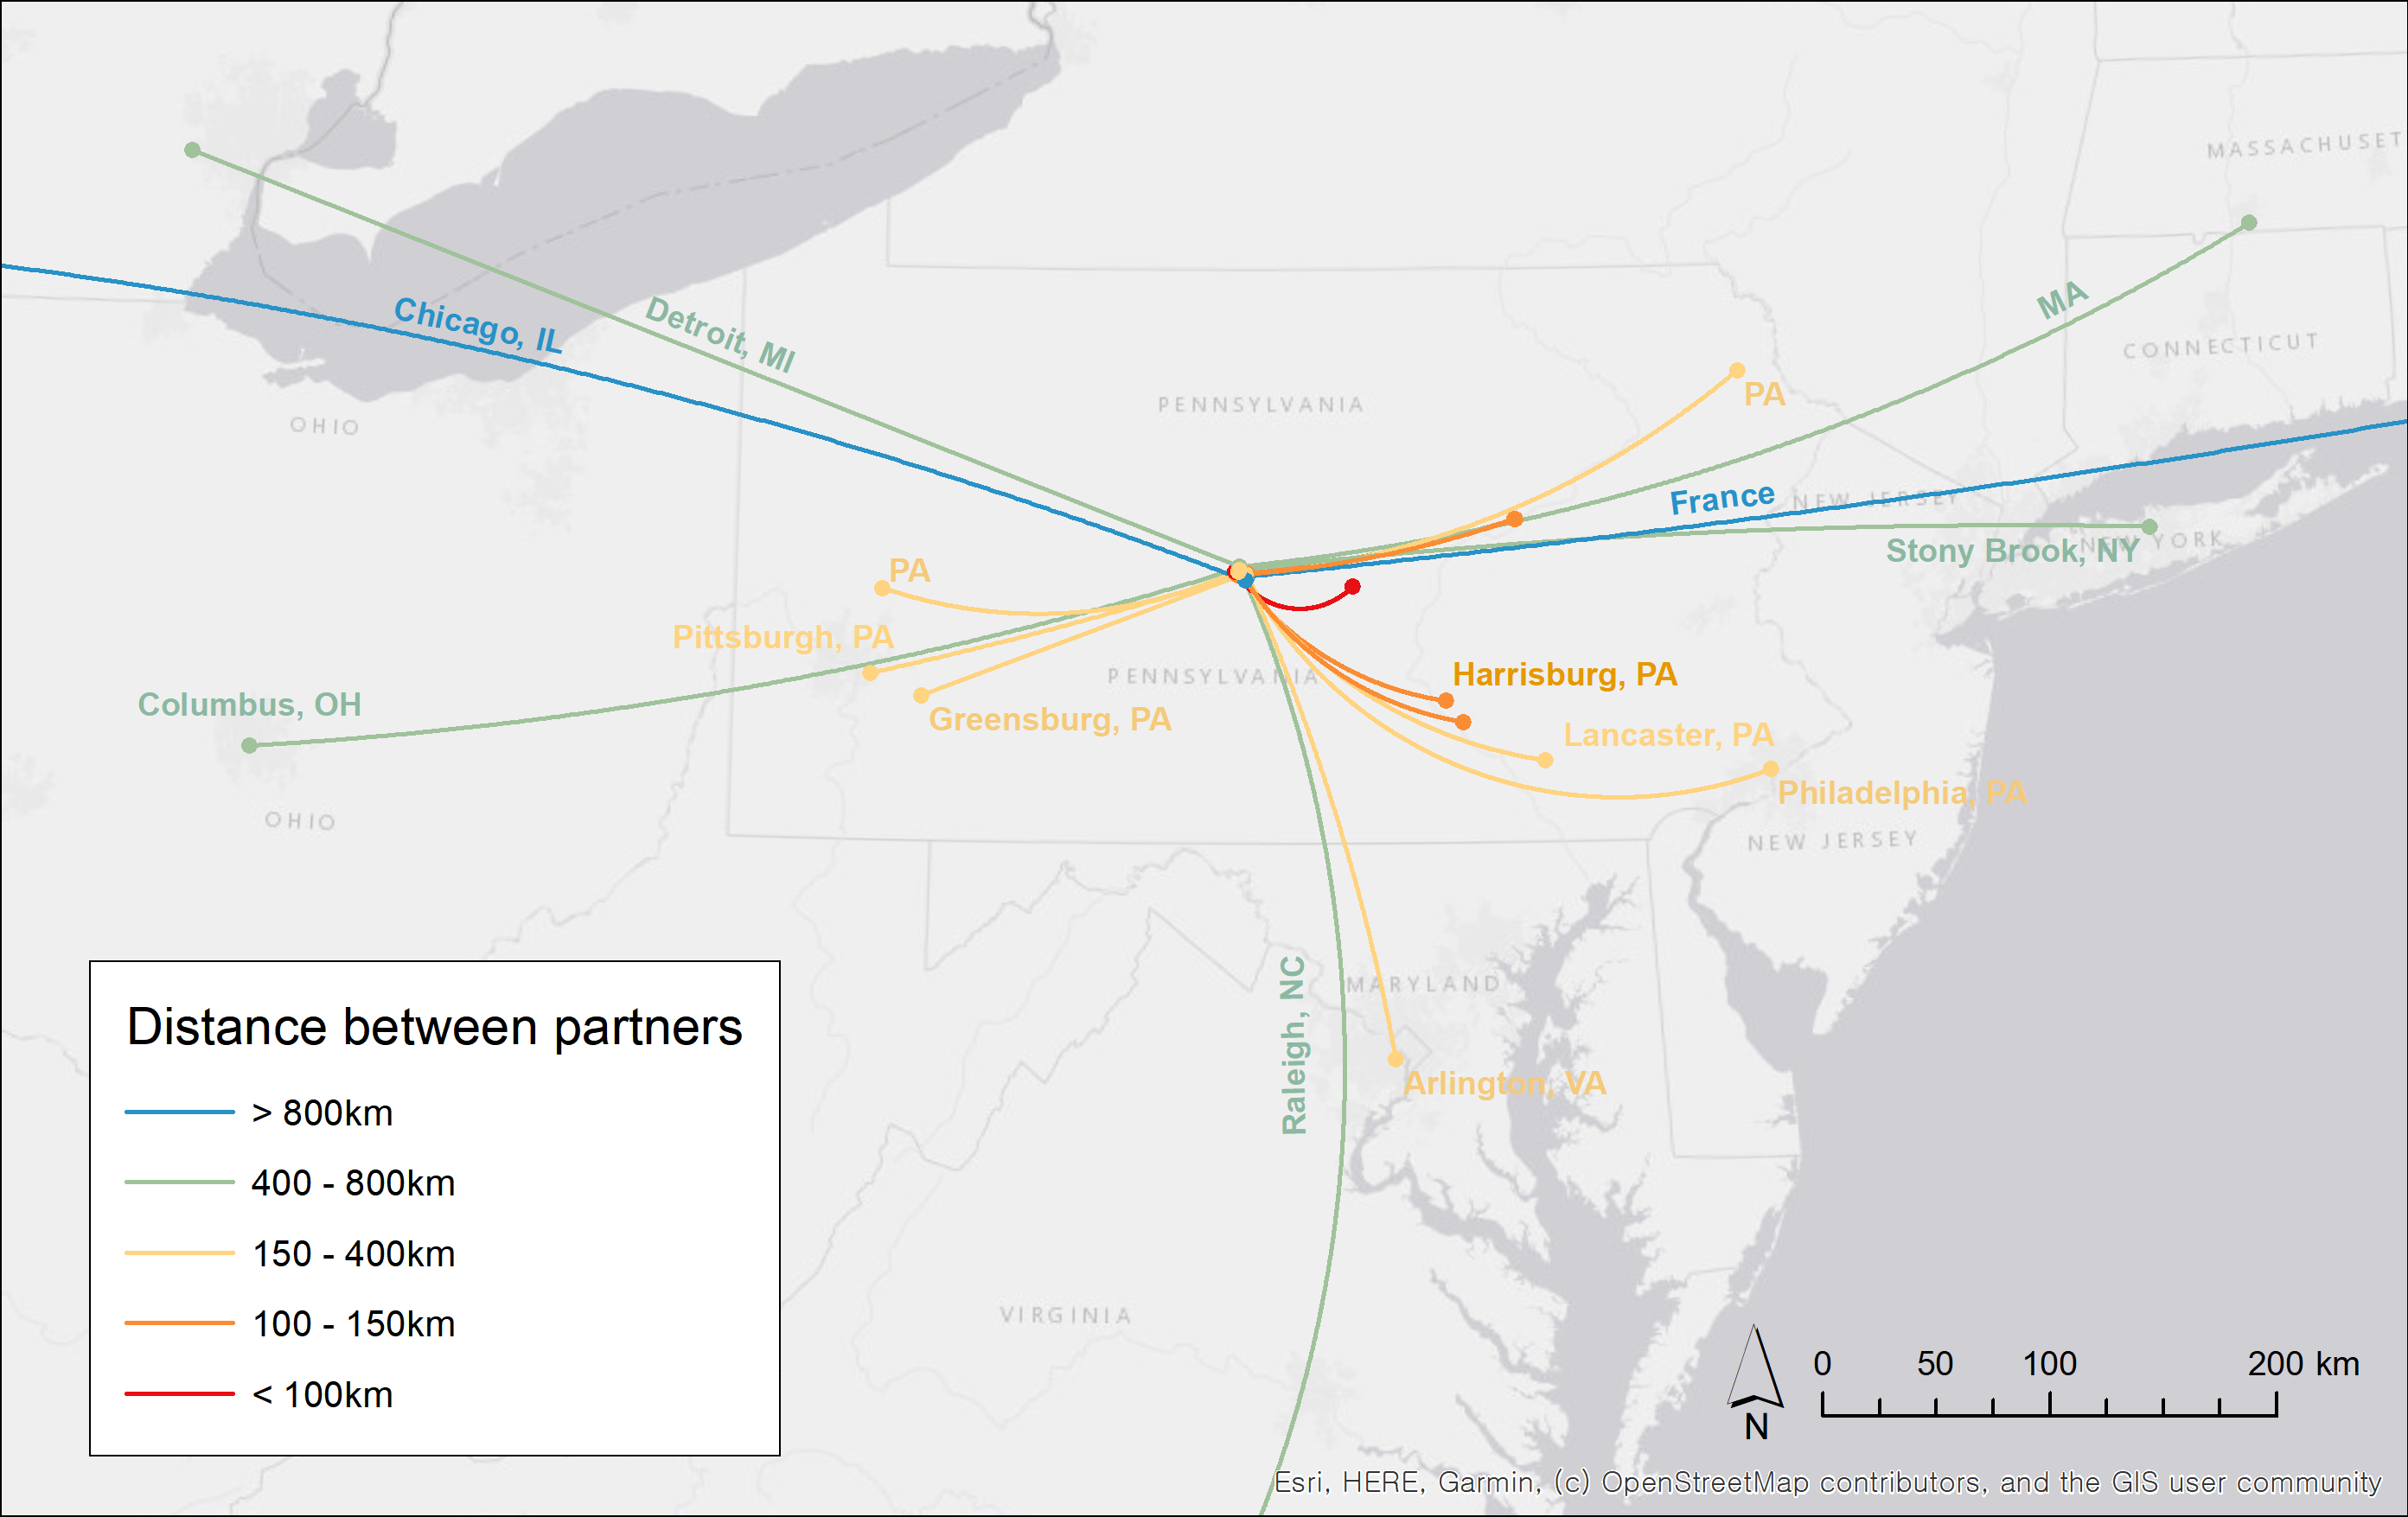
Route Factor Diagram (4) Are network-distant ties dispersed?
Network Flattening Ratio (4) Is the network spatially efficient?

See: Andris C, DellaPosta D, Freelin B N, Zhu X, Hinger B and Chen H (2021) To Racketeer Among Neighbors: Spatial Features of Criminal Collaboration in the American Mafia. International Journal of Geographical Information Science, DOI: 10.1080/13658816.2021.1884869. [PDF]

Measuring McCities: Chain and Independent Restaurant Location in the United States

In this research, we explored which (types of) places have an independent food culture and which resemble McCities: foodscapes where the food offerings in the landscape can be found just as easily in one place as in many other (often distant) places. We used a dataset of nearly 800,000 independent and chain restaurants for the contiguous United States and defined a chain restaurant using multiple methods. We performed a descriptive analysis of chainness prevalence at the urban area and metropolitan area level. We also identified socioeconomic and infrastructural factors that correlate with high or low “chainness” (a value indicating the likelihood of finding the same venue elsewhere) by combining a random forest model and linear regression. We then examined chainness variation across census tracts with similar sociodemographic values. Using common GIS operations, we evaluated the likelihood of finding chain restaurants of nearby water bodies, coastlines, and highway ramps.

We found that car-dependent small towns, low walkability, a high percentage of African American residents or Trump voters, college towns, and close distance to highways were associated with high chainness. These places tended to be prevalent in the Midwestern and the Southeastern U.S. Independent restaurants were associated with high pedestrian walkability, high population density, Asian, Hispanic and majority-White neighborhoods, tourist areas, areas with urban professionals, and retirement communities. They were also found in coastal cities and waterfronts. These findings, paired with the contribution of a method that quantifies ‘chainness’, opens new pathways for studying landscapes through the lens of commercialism and the service economy. See Environment and Planning B article. See Draft Manuscript. Play with the map!

Urban Planning for Romantic Relationships <3

We investigated what romantic relationships need from the built environment and how these relate to urbanism principles. Our research questions were threefold: (a) Where do couples spend their quality time and what are the characteristics of these places? (b) Does distance between these places and the couples’ residences affect usage? (c) How does State College, PA support romantic ties and how can it be improved? We conducted an online survey of 124 couples in the State College, PA area, and analyzed these data using frequency statistics, OLS regression, and qualitative coding. We also created maps of the relationships’ approximate locations and measured how their locations affected their activities.

We found that restaurants and the outdoors/recreation were most important for sustaining relationships. Couples frequently emphasized activities involving nature and sports/leisure time and rarely mentioned dinner parties, nightclubs, country clubs, or religious facilities. Couples reported that the town satisfied their relationship needs, especially in terms of safety (i.e. well-lit areas and pedestrian-friendly environments). We think this research can be useful during the COVID-19 pandemic, as cities try to support social ties amidst the closure of third places and social activities. Post COVID-19, it may also help inform which facilities to prioritize in terms of opening decisions post-pandemic.

Andris C and Lee S (2021) Romantic Relationships and the Built Environment: A Case Study of a US College TownJournal of Urbanism: International Research on Placemaking and Urban Sustainability, 1-22. (Online first). [PDF] and [Supplementary Information]

Savannah Blight, Civic Data Science for Equitable Development

Friendly Cities has a new collaboration with the City of Savannah to strategize decisions to address vacant and blighted properties in the community. Neighborhoods experiencing blight suffer from safety concerns and lower housing values, leading to suboptimal living conditions for already marginalized residents. Savannah’s Housing & Neighborhood Services Department also estimated that every blighted property bleeds $1300 of public funds annually. These funds are used to cover the unrecoverable costs of overgrown grass, litter, illegal dumping, securing open structures, and demolishing properties. In 2019, local voters approved the use of 10 million dollars to acquire and redevelop of at least 1,000 abandoned, blighted residential properties over the next 10 years to effect meaningful change in neighborhoods long neglected or exploited by profit-driven investors. However, strategizing which properties to intervene first and what kinds of interventions can be best applied for equitable development remains a challenge.

Our research revolves around developing a human-in-the-loop machine learning model to help the city identify vacant, abandoned, and disinvested (VAD) properties. The human-in-the-loop approach entails closely collaborating with the housing planners to identify areas for interventions, feature selections, active learning (diversity and uncertainty sampling techniques), and interpretable machine learning outcomes. We also compare our model outcomes with human-found VAD properties, check robustness with 2021 data, and conduct an empirical analysis to determine which neighborhoods may be subject to data bias. This project is funded by the Georgia Smart Communities Challenge 2020 jointly with Brian Brainerd of the City of Savannah. Graduate Research Assistant Xiaofan Liang is leading the analysis. The links attach media reports from Savannah government and Georgia Tech. See Xiaofan’s presentation at ACSP conference here Savannah_ACSP_presentation.

The Built Environment and Syrian Refugee Integration in Turkey: An Analysis of Mobile Phone Data

We use a large call detail record (CDR) dataset from mobile operator Türk Telekom to examine how refugees from the Syrian Refugee Crisis are integrating into Turkish society. We extract different types of callers from the social network: refugees who often call Turkish nationals, refugees who do not call Turks; Turks who often call refugees, and Turks who do not call refugees. We consider frequent phone calls between refugees and Turks to indicate high levels of bridging social capital for these users, and that refugees tied to Turkish nationals through calls have integrated into the Turkish society, economically and/or socially. We also assume that Turks who often call refugees are investing in creating these relationships (although these comprise a relatively small set of users).

We found few significant geographic patterns for refugees who were calling Turks often. However, bridging Turks were found to be located near infrastructural variables such as places of worship, schools, community centers, and social centers/facilities, more often than their non-bridging counterparts. These differences were strongest in locales with Muslim and Sunni Muslim places of worship. In these locales, presumably, refugees and Turkish nationals share common values and beliefs. Our results provide quantitative evidence suggesting the significance of social amenities and meeting places for face-to-face connection and social support for the livelihoods of refugees and refugee integration

Mapping the Distribution and Spread of Social Ties Over Time: A Case Study Using Facebook Friends

Relational geography asserts that social networks provide geographic benefits, and geographies are transmitted through the sharing of local knowledge and experience. In this work, the authors conduct a case study to map social network ties in geographic space. The authors retrieve social network matrices for 20 volunteers (egos) via Facebook.com, amounting to over 8,500 friends (alters). Each ego listed the alter’s hometown city at two time periods: at relationship inception and at the time of the study. The authors measure specific tie locations, tie expanse, deviation from a gravity model prediction, and expansion of the alter groups (family, clubs, neighbors, etc.) over time.

The authors find that social networks geographically spread over time, on average, from 2,679 km (standard distance) to 3,258 km (standard distance), and that the average ego had alters in 21 unique locations when they met, and 38 locations at the time of the study. Regarding friend groups, the authors discover that high school friends and friends from non-residential gatherings (ex. conferences) dispersed the most (over 1,900 km), and cultural groups (churches, sports teams) and family dispersed the least (less than 800 km) over time. Our results lead to a discussion of how mapping and measuring the distribution of social connections can uncover changing dynamics of social interaction, and one’s ability to access and engage with places through social ties.

Andris C, Cavallo S, Dzwonczyk E, Clemente-Harding L, Hultquist C and Ozanne M (2019) Mapping the Distribution and Spread of Social Ties Over Time: A Case Study Using Facebook Friends. Connections: Journal of the International Network for Social Network Analysis. 1(39): 1-17.

Threads Across the Urban Fabric: Personal Relationships in the City

Through a partnership with Big Brothers Big Sisters (BBBS), we model geolocated mentorships as personal day-to-day interaction across urban neighborhoods. We use a novel dataset of over 12,000 BBBS “Bigs” and “Littles”, in seven U.S. American cities (Philadelphia, Tampa, Kansas City, Dallas, Houston, Denver, and Los Angeles). Using statistical tests and GIS, we find that “matches” live closer than simulated pairs. Despite being geographically close, matches create socio-economic bridges. Little neighborhoods have a higher percentage of African Americans and significantly fewer bachelor’s degrees, more unemployment, and lower median household income than Big neighborhoods. Neither matches nor simulated pairs align with the network of urban commuting patterns. We also find that Bigs hail from inner-city areas, suggesting civic engagement and ‘giving back’ of (often young) adults who choose to live in the city.

Results suggest that social-capital-facilitating organizations create a spillover effect by facilitating bridges between neighborhoods and disconnected social networks, benefiting the larger city. This work can help inform research in geography, city science, and sociology and advance the quantitative study of economic social systems within the urban environment.

Poster Winner, Urban Geography Specialty Group Poster Competition: Understanding the 21st Century City,Association of American Geographers Annual Meeting, 2019.

See related paper at: Andris, C., Liu, X., Mitchell, J., O’Dwyer, J., & Van Cleve, J. (2019). Threads across the urban fabric: Youth mentorship relationships as neighborhood bridges. Journal of Urban Affairs, 1-16. Special Issue Edited by Z Neal and B Derudder.

Challenges for Social Flows

The social flow is a linear geographic feature that evidences an individual’s decision to connect places through travel, telecommunications and/or declaring personal relationships. These flows differ from traditional spatial networks (roads, etc.) because they are often non-planar, and provide evidence of personal intentionality to interact with the built environment and/or to perpetuate relationships with others.

We use tons of social flow data in today’s research, and so, we create new typologies, address new problems, and redefine social distance as the manifestation of social flows. We describe challenges for leveraging these data with commercial GISystems in terms of representing, visualizing, manipulating, statistically analyzing and ascribing meaning to social flows.

Measuring Geographic Pull Power: A Case Study of College Athletics

Student athletes increase the diversity of schools. Which universities draw students from distant and diverse locales? We put together “pull power statistics” for 160,000 student-athletes from more than 1,600 university team rosters at 128 schools over various years. Stats include mean distance traveled, count of unique hometowns, percentage of international student-athletes, and a new distance decay “apex” method to rank schools by their pull power. Western U.S. (like U. Idaho and U. Arizona) and private schools (like Harvard) lead the ranks. Schools like Rutgers, Catholic University, UMBC and U. Illinois-Chicago have a lot of local student athletes.

Using Yelp to Find Romance in the City: A Case of Restaurants in Four Cities

Findings: There’s a certifiable difference in urban hot spots and demand depending on couples’ relationship stage. Key factors for selecting a romantic date spot include ambiance (cozy & classy atmosphere), high prices, and downtown locations. Couples with families (children) tend to prefer less expensive restaurants, with great service and (probably) accessible parking. Special occasion locations are concentrated in downtown areas, especially for Las Vegas and Pittsburgh, but are more distributed for sprawling cities like Phoenix and Charlotte.

Method: Natural Language Processing of Yelp reviews to scan for correlations of certain keywords, cross-referenced with locations of restaurants.

Good For: If you are opening a bar or restaurant and would like to influence the potential clientele, or if you would like to glean insight into the romantic life cycle.