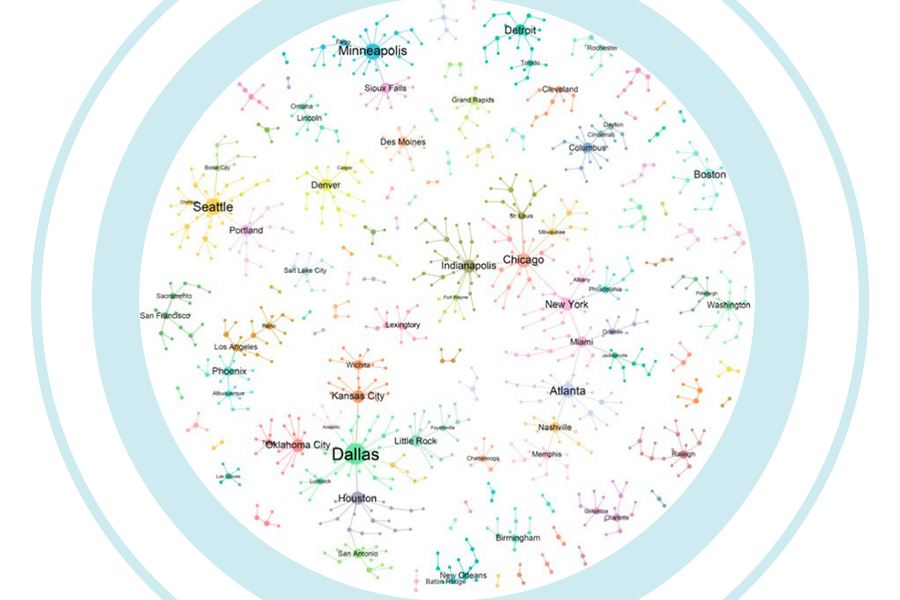
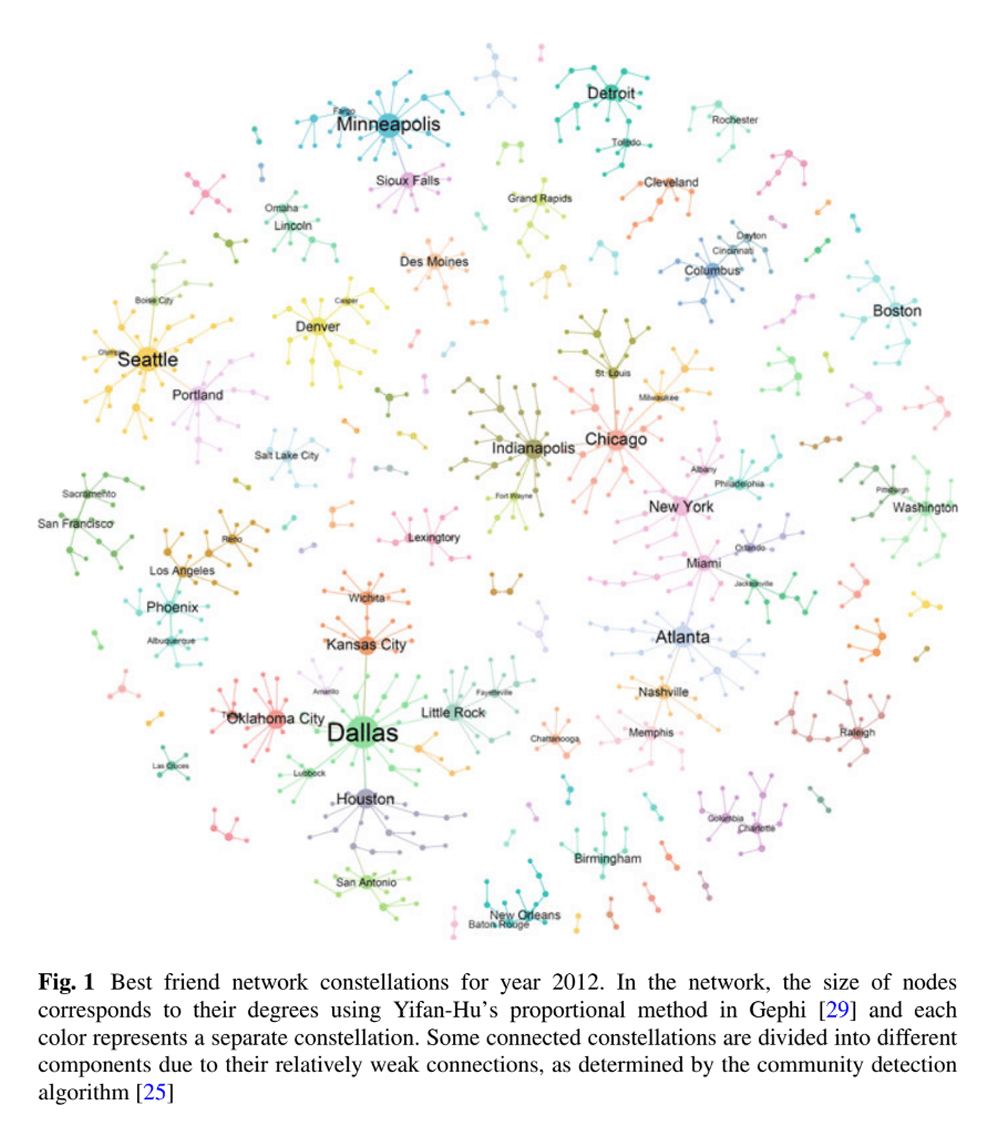
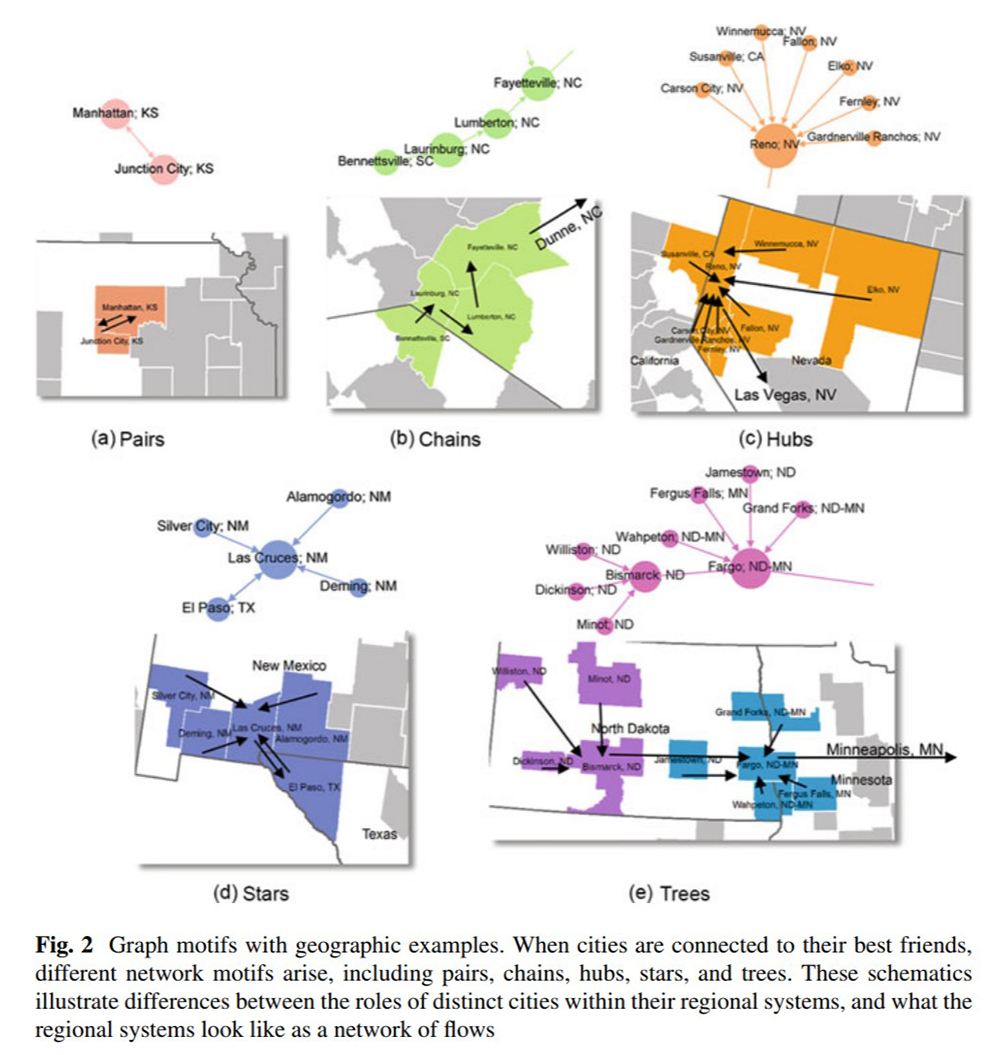
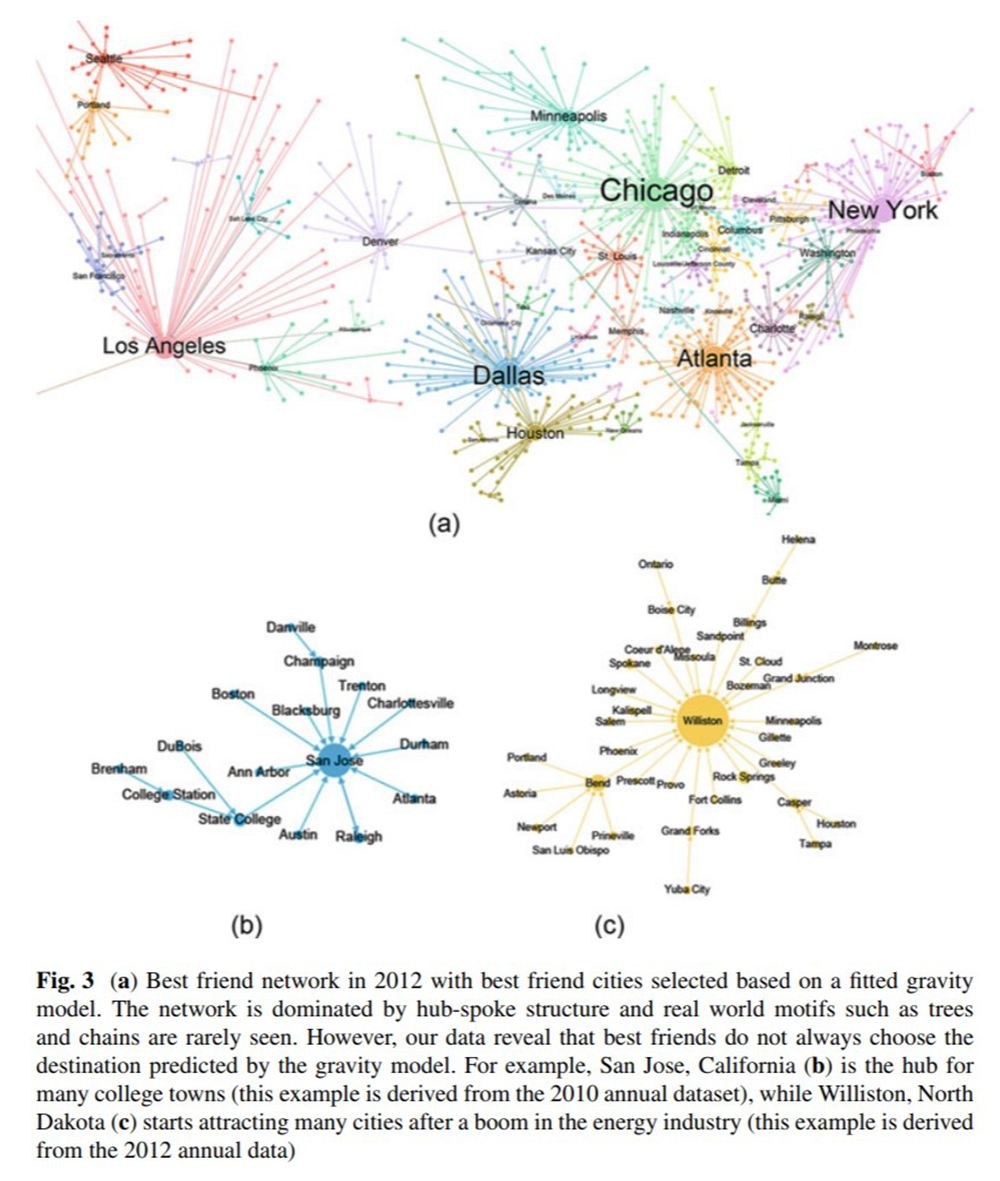
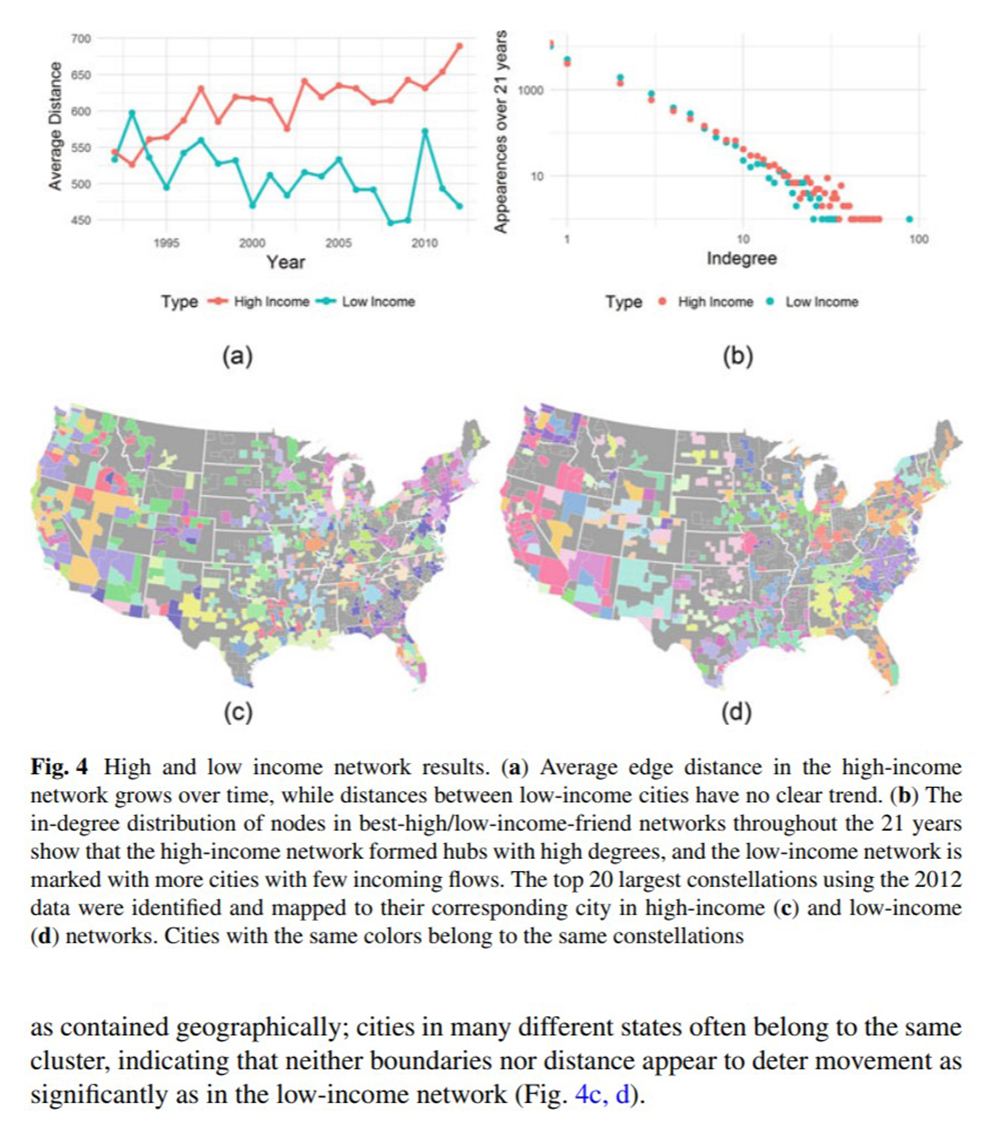
Findings: Geographically isolated, large cities (like Dallas and Phoenix) tend to receive the most migrants from other US cities. Destination cities turn over regularly over time. The overall diversity of destinations (bag-of-cities) for migrants is decreasing despite the rise of mobile technologies, i.e. migrants now have ‘hot spots’ that they go to, instead of a distributed set of options like in the early 1990s. We find this counter-intuitive, as the Internet makes it easier to search for new jobs and housing in distant places. Poorer migrants tend to follow chains of nearby cities, while richer migrants create a hub and spoke network, where the hubs are often retirement areas in Florida like Cape Coral.
Method: Mapping US migration flows in constellations, assigning nodes and edges to cities, and charting changes based on 20 years of IRS data at the MSA Level.
Good For: If you would like to learn more about where a population of a given city lived previously, or if you are interested in predicting where people will go. Any business marketing to transplant demographics. Guide to using graph theory motifs for urban networks.

