Migrant Routing the U.S. Urban System

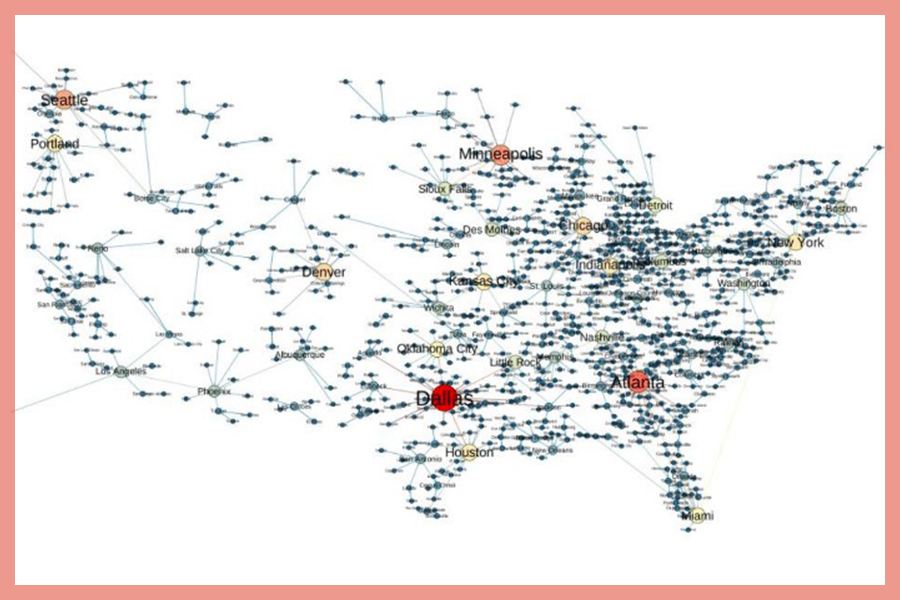
Findings: A city is a cityfriend with a city that sends the most migrants. Cities like Dallas and Atlanta have many cityfriends since they are central hubs for local migration. Wealthier people will move to certain places like Phoenix and Naples more often than places like LA and Austin.

Method: Use network schematics of migration movement dynamics to illustrate differentiation between the roles of cities in their regional systems.

Good For: If you would like to learn where people will migrate to or to predict economic gains and losses of cities based on migration flows. If you work with an American at-risk industry in a given city and want to predict labor availability.

Liu X and Andris C (2016) Migrant Routing the U.S. Urban System. GIScience, Sept 27, Montreal.

Hidden Style in the City: An Analysis of Geolocated Airbnb Rental Images in Ten Major Cities

Findings: Photos in international AirBNB listings are starting to have more in common as globalization homogenizes the wold. However, variation between listings in neighborhoods is rising.

Method: 500,000 images downloaded from AirBNB were rated by Mechanical Turk participants.

Good For: If you want to learn how citizens of different locales decorate their homes differently, or to identify favorable interiors to global customers. Useful for AirBNB hosts or hotel marketers seeking a competitive advantage.

Using Migration Degree to Distinguish Post-Industrial U.S. Cities

Findings: People do not move out of Boston for the same reasons they move out of Detroit. When we look at migration in and out of cities, we can use smarter metrics to classify the economic health of a city.

Methods: Regresses a network of US CBSA to CBSA migration flows for more than 200 million people in Pennsylvania from 1990-2011.

Good for: If you are attempting to clarify and rehabilitate the image of a city, or plan how to increase population inflows. Housing developers may find value in predicting inflows/outflows of certain demographics.

LBSN and the Social Butterfly Effect

Findings: The Butterfly Effect is measurable. There is a 14-point scale of how much impact a Location Based Social Network event has on the world. The lightest is one person speaking to another and the most significant is the migration of 7,000 people.

Methods: Presentation of a 14-tier scale for navigating spatial patterns, along with pectoral representations.

Good for: If you are interested in classifying the root causes of why people go places, ranging from the selection of a retirement community to travel of emigrants after an infestation.

Linked Activity Spaces: A New Approach for Spatializing Social Networks

Findings: Phone call friends use the city similarly, and you have a higher chance of running into a friend if you live in the suburbs.

Method: mapping ellipse-shaped polygons of where people make/receive calls in Jiamusi China, and those of his or her phone call friends.

Good for: if you have a geolocated social network and you want to learn more about who uses which parts of the city, and whether the city is set up for friendships. Hospitality focused companies could choose locations based on where interactions are most likely to happen.

The Rise of Partisanship and Super-Cooperators in the U.S. House of Representatives

Findings: Analysis of voting records show proof that US congresspeople are more partisan than ever. Thankfully, Texan Democrats and Northeastern Republicans  are ‘supercooperators’ who have stepped across party lines.

Methods: Charting frequency distributions of roll call vote data from the U.S. House of Representatives from 1949 to 2012 to display cross-party voting patterns.

Good for: If you are interested in the gradual polarization of American congress people, or would like to learn which congress people cooperate outside of their party.

Geocomputation Methods for Dyadic Relationships

Findings: People who participated in a mentoring program in Santa Fe formed strong relationships regardless of the wide-ranging barriers (from distance to lack of social ties) between the pair of participants.

Methods: Gravity models show results of a two-tailed Kolmogorov-Smirnoff test.

Good for: If you are looking to start a mentoring program or participate in one.

Exploring Institution-Driven Mobility

Findings: Certain colleges like West Virginia and Providence have much less ‘pull power’ to attract far-away athletes than schools like Stanford or Kenyon College.

Methods: Data analysis from over 1000 U.S. university athletics webpages from 78 universities, 20 different types of sports, to produce a 90,000+ record dataset of U.S. and international student athletes and their hometowns.

Good for: If you hope to improve a collegiate athletic team by diagnosing and expanding its geographic reach. If you are interested in selling more collegiate apparel by targeting feeder areas.

An ocean of information: Fusing Aggregate & Individual Dynamics for Metropolitan Areas

Findings: A new tool called Ocean of Information helps track flows of people over time with 3D visualizations.

Method: Combining where people move as groups and as individuals and offering interactive tools for finding patterns, applied to Massachusetts during a Madonna concert and the 2006 World Cup Final.

Good for: If you are exploring how viruses spread in a city or if you are planning a large public event and want to predict how crowds will behave.

Martino M, Calabrese F, DiLorenzo G, Andris C, Liu L and Ratti C (2010) An ocean of information: Fusing Aggregate & Individual Dynamics for Metropolitan Areas. Proceedings of the 14th International ACM Conference on Intelligent User Interfaces (IUI ’10). Feb 7-10, Hong Kong, China, 357-360.